. 2011 Feb 10;6(2):e17041.
doi: 10.1371/journal.pone.0017041.

Cortical modulation of the transient visual response at thalamic level: a TMS study

Affiliations

Cortical modulation of the transient visual response at thalamic level: a TMS study

Nelson Espinosa et al. PLoS One. .

Abstract

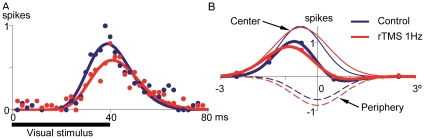
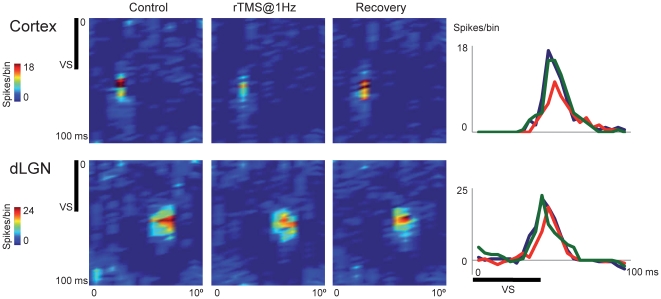
The transient visual response of feline dorsal lateral geniculate nucleus (dLGN) cells was studied under control conditions and during the application of repetitive transcranial magnetic stimulation at 1 Hz (rTMS@1Hz) on the primary visual cortex (V1). The results show that rTMS@1Hz modulates the firing mode of Y cells, inducing an increase in burst spikes and a decrease in tonic firing. On the other hand, rTMS@1Hz modifies the spatiotemporal characteristics of receptive fields of X cells, inducing a delay and a decrease of the peak response, and a change of the surround/center amplitude ratio of RF profiles. These results indicate that V1 controls the activity of the visual thalamus in a different way in the X and Y pathways, and that this feedback control is consistent with functional roles associated with each cell type.


Conflict of interest statement

Competing Interests: All authors belong to the University of A Coruña, Neuroscience and Motor Control Group (NEUROcom) and Biomedical Institute of A Coruña (INIBIC). The authors have declared that no competing interests exist.

Figures

Figure 1
Figure 1. Percentage of spikes in burst mode for X cells.
A , Distribution of the percentage of spikes in burst for the response of X dLGN cells. B, In these cells, the percentage of spikes in burst remained unaltered with rTMS@1Hz.
Figure 2
Figure 2. Distribution of the percentage of spikes in burst for the response of Y dLGN cells.
A, Cluster analysis splits the population in two groups around 40–50% (dashed line). B, Distribution of the spikes per burst for Y dLGN cells. Neurons whose response had a low content of burst spikes (<40–50%, dark bars) mainly emitted bursts with two spikes. In contrast, cells with a high content of burst spikes (>40–50%, white bars) produced bursts with relatively more spikes. Vertical error bars represent the standard error of the mean.
Figure 3
Figure 3. Analysis of Y dLGN cells whose percentage of response in burst was less than 40–50%.
rTMS@1Hz increased the percentage of spikes in burst ( A ) and consequently decreased tonic spikes ( B ). Changes in response mode were reflected, as well, in the number of bursts ( C ). D F, rTMS@1Hz did not alter the response mode of Y dLGN cells whose percentage of response in burst was more than 40–50%. G , An example of a Y dLGN cell response whose percentage of spikes in burst during control condition (black line) was 29%. rTMS@1Hz increased spikes in burst to 38% (gray line, bin = 2 ms). Vertical error bars represent the standard error of the mean.
Figure 4
Figure 4. Scatter plot obtained subtracting average intervalogram of rTMS from control condition for X dLGN cells.
Blue and red dots represent decrease and increase of interspike intervals (X axis) along the time (Y axis) respectively. Dot size depicts the magnitude of change and black bar shows the duration of visual stimulus. Asterisk indicates the interspike interval range for spikes in burst.
Figure 5
Figure 5. Scatter plot for Y cells.
Scatter plot of changes on intervalograms induced by rTMS@1Hz for Y dLGN cells with low ( A ) and high ( B ) content of bursts.
Figure 6
Figure 6. Example of a dLGN X-on cell whose STRF profile was modified by rTMS@1Hz.
Circles represent real values normalized to control and curves their mathematical fits. A, Transient response elicited by a white bar presented at the RF center shows a decrease in peak value (from 80 to 60%) and an increase in latency (from 39 to 41 ms) when rTMS was applied. B, Construction of RF profile by fitting a difference of Gaussians (DoG) function to real values. rTMS@1Hz modified the rate between Gaussian amplitudes by a decrease of the center (upper thin curve) and an increase of the periphery (lower thin curves).
Figure 7
Figure 7. Effect of rTMS on X cells.
rTMS@1Hz decreased ( A ) and delayed ( B ) the peak transient response and induced an increase in the rate between periphery and center amplitudes ( C ) in dLGN X-cells (bin = 2 ms). Vertical error bars represent the standard error of the mean.
Figure 8
Figure 8. Spatiotemporal receptive field (STRF) profile obtained from a one-dimensional reverse correlation procedure.
Visual stimulus is a randomized sequence of bright and dark bars centered at the dLGN cell's RF. A , Simplified figure (10 bars) showing two of the white bars (6 & 8) presented to the dLGN cell. B , Peristimulus time histogram (PSTH) from bars 6 & 8. Bin size: 2 ms. C , Spatiotemporal profiles obtained from white (ON) and dark (OFF) bar series. D , STRF obtained by subtracting OFF from ON spatiotemporal profile. E , Spatial RF profile obtained by slicing in the STRF through the RF center at peak response. F , Temporal profile derived by slicing in the STRF through the RF center. Mathematical approaches (solid curves) are obtained from real values (filled circles; see text for details).
Figure 9
Figure 9. Example of the effect of rTMS on cortical cells.
Top panel: rTMS stimulation produced a reduction in the peak response (red curve) compared to the pre rTMS values (blue curve). Green curve depicts the recovery of the response (bin = 4 ms). The cell was recorded in the deeper layers of V1. The effect of rTMS on a dLGN cell recorded simultaneously is also shown (bottom panel).
Figure 10
Figure 10. Construction of intervalograms.
A, Spikes elicited by a dark bar (VS) presented on RF center of a Y off dLGN cell. Interval distributions are computed for small time windows of 50 ms shifted 5 ms each other along the time axis. An inter-spike interval histogram (INTH) is calculated for each window (1, 2, 3, … 40) by adding all interval distributions obtained from each dark bar presented on RF center of the dLGN cell. INTHs are plotted as a colour-scaled horizontal pixel line and all the intervalogram is normalized to its maximum value. B, Average intervalogram for all Y dLGN cells. The temporal resolution for the horizontal axis is 1 ms and the maximum value is limited by the time window, i.e. 50 ms. The temporal resolution for the vertical axis is determined by the interval between time windows, i.e. 5 ms and maximum value is 200 ms. C , First INTH of the average intervalogram showed in B. D , INTH from the average intervalogram at the end of the VS.

Similar articles

Cited by

References

    1. Kalil RE, Chase R. Corticofugal influence on activity of lateral geniculate neurons in the cat. J Neurophysiol. 1970;33:459–474. - PubMed
    1. Singer W. Control of thalamic transmission by corticofugal and ascending reticular pathways in the visual system. Physiol Rev. 1977;57:386–420. - PubMed
    1. Geisert EE, Langsetmo A, Spear PD. Influence of the cortico-geniculate pathway on response properties of cat lateral geniculate neurons. Brain Res. 1981;208:409–415. - PubMed
    1. McClurkin JW, Marrocco RT. Visual cortical input alters spatial tuning in monkey lateral geniculate nucleus cells. J Physiol (Lond) 1984;348:135–152. - PMC - PubMed
    1. Murphy PC, Sillito AM. Corticofugal feedback influences the generation of length tuning in the visual pathway. Nature. 1987;329:727–729. - PubMed

Publication types