. 2011 Feb 10;7(2):e1001294.
doi: 10.1371/journal.pgen.1001294.

Epistatic interaction maps relative to multiple metabolic phenotypes

Affiliations

Epistatic interaction maps relative to multiple metabolic phenotypes

Evan S Snitkin et al. PLoS Genet. .

Abstract

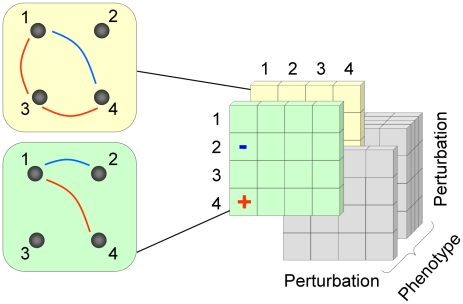
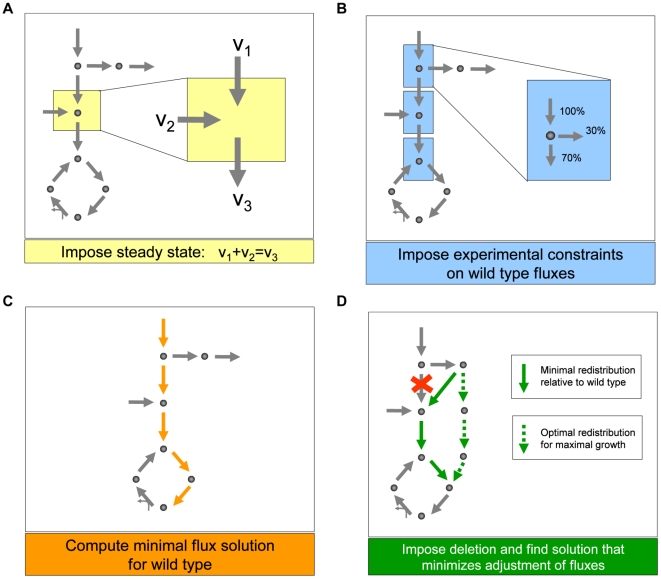
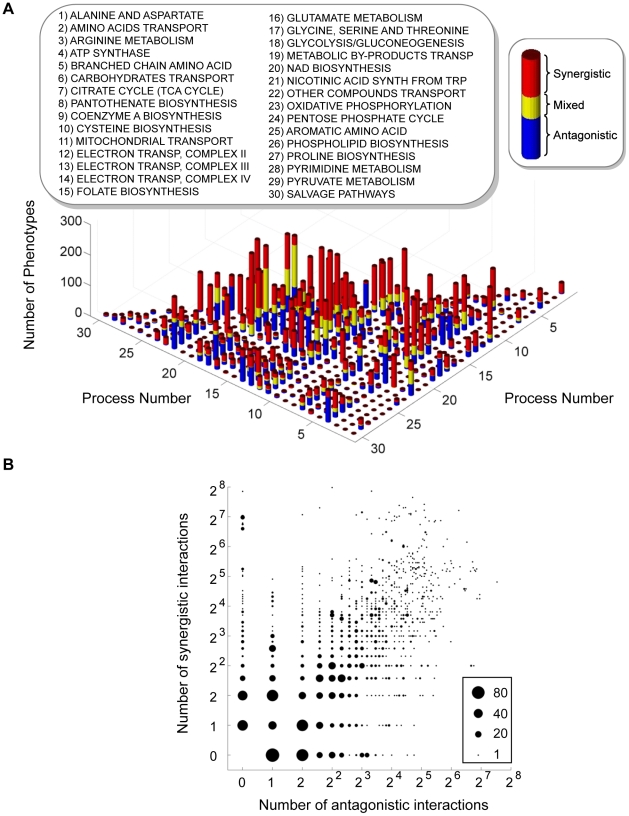
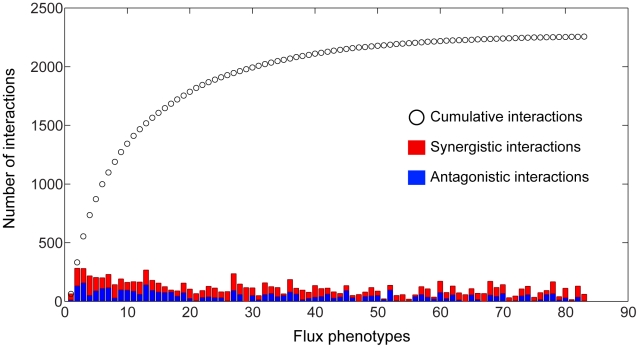
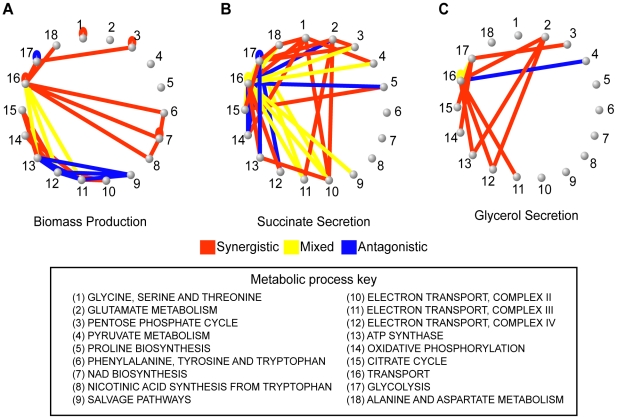
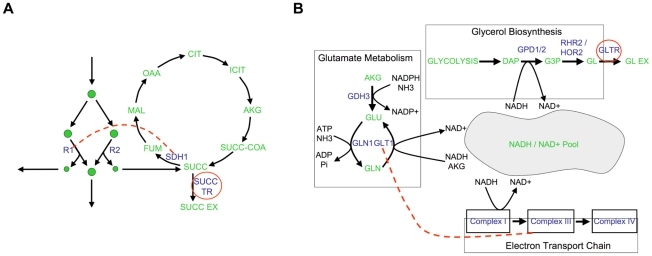
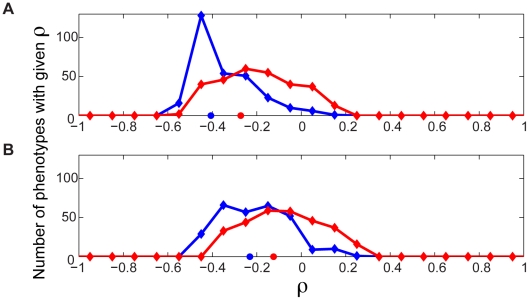
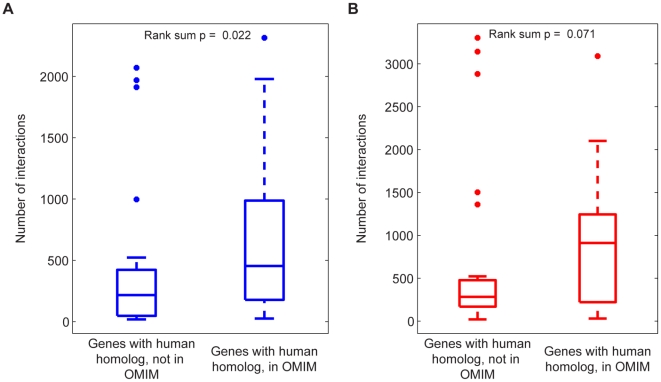
An epistatic interaction between two genes occurs when the phenotypic impact of one gene depends on another gene, often exposing a functional association between them. Due to experimental scalability and to evolutionary significance, abundant work has been focused on studying how epistasis affects cellular growth rate, most notably in yeast. However, epistasis likely influences many different phenotypes, affecting our capacity to understand cellular functions, biochemical networks adaptation, and genetic diseases. Despite its broad significance, the extent and nature of epistasis relative to different phenotypes remain fundamentally unexplored. Here we use genome-scale metabolic network modeling to investigate the extent and properties of epistatic interactions relative to multiple phenotypes. Specifically, using an experimentally refined stoichiometric model for Saccharomyces cerevisiae, we computed a three-dimensional matrix of epistatic interactions between any two enzyme gene deletions, with respect to all metabolic flux phenotypes. We found that the total number of epistatic interactions between enzymes increases rapidly as phenotypes are added, plateauing at approximately 80 phenotypes, to an overall connectivity that is roughly 8-fold larger than the one observed relative to growth alone. Looking at interactions across all phenotypes, we found that gene pairs interact incoherently relative to different phenotypes, i.e. antagonistically relative to some phenotypes and synergistically relative to others. Specific deletion-deletion-phenotype triplets can be explained metabolically, suggesting a highly informative role of multi-phenotype epistasis in mapping cellular functions. Finally, we found that genes involved in many interactions across multiple phenotypes are more highly expressed, evolve slower, and tend to be associated with diseases, indicating that the importance of genes is hidden in their total phenotypic impact. Our predictions indicate a pervasiveness of nonlinear effects in how genetic perturbations affect multiple metabolic phenotypes. The approaches and results reported could influence future efforts in understanding metabolic diseases and the role of biochemical regulation in the cell.


Conflict of interest statement

The authors have declared that no competing interests exist.

Figures

Figure 1
Figure 1. A schematic representation of the 3D epistatic map.
The 3D epistatic map is represented as a 3-dimensional entity (perturbation by perturbation by phenotype). Each “slice” of the 3D epistatic map represents an epistatic interaction network, created with respect to a single phenotype. Previous genome-scale studies of epistasis in yeast metabolism have focused on a single “slice”, whose interactions were computed with respect to the biomass production phenotype.
Figure 2
Figure 2. Schematic depiction of the main steps we used to generate predictions of metabolic fluxes for yeast single and double deletion mutants.
(A) As in any flux balance model, we implement a steady state approximation, yielding for each metabolite in the network a linear constraint on reaction rates (fluxes). (B) We then generate the best possible flux state for the wild type, using flux and growth rate data from the literature as additional constraints, and (C) minimizing the sum of the absolute values of all fluxes. This last step prevents the generation of arbitrarily large loops of fluxes associated with alternative optima. (D) Lastly, to generate flux predictions for the deletion mutants, we impose that the fluxes associated with the deleted genes be set to zero, and identify the flux state for the mutant that is as close as possible to the wild type state, identified in step C. Note that this approach does not employ growth rate maximization, as often done in flux balance analysis. Instead, using the concept of minimization of metabolic adjustment , it searches for mutant fluxes that undergo minimal rerouting relative to the (experimentally tuned) wild type flux solution. This approach was proven to be the most accurate way of predicting fluxes in yeast knockout strains.
Figure 3
Figure 3. Interactions in the yeast multi-phenotype epistatic map.
(A) Histogram of the number of phenotypes relative to which different metabolic processes interact with synergistic (red), antagonistic (blue) or mixed (yellow) interactions. Two processes are said to interact with respect to some phenotype if any two genes belonging to those processes interact. Mixed interactions occur when different gene pairs from the same pair of processes interact differently (antagonistic or synergistic) relative to the same phenotype. (B) Interaction classes for gene pairs across multiple phenotypes. In the multi-phenotype interaction map, one can ask how many gene pairs interact synergistically with respect to a number ns of different phenotypes and antagonistically with respect to a number na of phenotypes. In this graph, for each pair (ns, na) we plot a circle with diameter proportional to the number of gene pairs displaying such interaction pattern. Only gene pairs that interact relative to at least one flux phenotype are included.
Figure 4
Figure 4. Coverage of the 3D epistasis map.
The total number of antagonistic and synergistic interactions for each phenotype are displayed as stacked bars, with the cumulative sum of interactions at a given point in the list being represented by a black circle. Phenotypes were sorted according to the number of unique interactions added to a cumulative tally. It should be noted that the first phenotype in the list is the biomass flux, which does not have the maximal number of interactions. It was placed first so as to clearly demonstrate the gain in interaction coverage by observing non-growth phenotypes. Only the first 83 phenotypes are shown, as the number of unique interactions reaches saturation at this point.
Figure 5
Figure 5. Epistatic networks with respect to growth rate and two other flux phenotypes.
To explore the biological diversity underlying the different epistatic networks, the presence of synergistic and antagonistic interactions between pairs of metabolic processes were determined for (A) growth, (B) succinate secretion and (C) glycerol secretion phenotypes. These process interactions are visualized as networks, where nodes are biological processes and edges indicate that gene pairs in the two biological processes interact antagonistically (blue), synergistically (red) or mixed (yellow). Visualizing the interaction networks in this way demonstrates that the variability in interaction coverage found relative to different phenotypes is a consequence of phenotype-specific interactions among completely different biological processes. Specific process interactions observed in these networks are described in detail in Figure 6 and in Text S1.
Figure 6
Figure 6. Examples of epistatic interactions (red dashed lines) with respect to flux phenotypes (red circles), overlaid on the corresponding metabolic pathways.
(A) In Figure 5B, there is an abundance of synergistic interactions between complex II of the electron transport chain (ETC II) and various other biological processes, with respect to succinate secretion. The basis for these interactions is the fact that ETC II catalyzes the succinate dehydrogenase reaction (SDH), which is the major flux consuming succinate under the modeled condition. If SDH is deleted, succinate is predicted to be secreted from the cell. Therefore, a gene deletion resulting in an increase in flux through SDH, will be observed to interact synergistically with SDH relative to succinate secretion. (B) A second predicted interaction is a positive synergistic interaction between glt1 and cox1 relative to glycerol secretion as a phenotype. The metabolic basis for this interaction is the involvement of both the genes and the phenotype in NADH/NAD balancing. Specifically, glt1 is an NADH dependent reaction, and in its absence, glutamate is synthesized by the NADPH dependant glutamate dehydrogenase reaction. Therefore, the deletion of glt1 leaves an excess of NADH, which is in turn oxidized via the respiratory chain. In the cox1 mutant, the respiratory chain is no longer functional, and the redox imbalance is alleviated through glycerol production (Figure S9). Hence, there is an unexpectedly large increase in glycerol secretion in the double mutant, relative to what is observed in the single mutants.
Figure 7
Figure 7. Evolutionary significance of epistasis with respect to metabolic flux phenotypes.
The number of antagonistic and synergistic epistatic interactions for each of 39 genes was determined across each of the 293 flux phenotypes. (A) For each phenotype, the number of synergistic and antagonistic interactions involving the genes was correlated separately with the Ka/Ks of the genes, yielding distributions of Spearman Rank Correlation ρ values for synergistic (red) and antagonistic (blue) interactions. Both distributions are significantly skewed towards negative ρ values (sign test p = 8.5×10⁻²⁵ (synergistic), 2.2×10−54 (antagonistic)). The red and blue circles indicate the correlation coefficient when the total numbers of synergistic (ρ = −0.27, p = 0.09, n = 39) and antagonistic (ρ = −0.41 p = 0.01, n = 39) interactions across all phenotypes are considered. (B) The above correlations were repeated, but controlling for the codon bias of the genes using partial correlation analysis. The distributions of ρ move closer to zero, with only the distribution for antagonistic interactions remaining significantly different from zero (sign test p = 0.07 (synergistic), 2.3×10⁻³¹ (antagonistic)).
Figure 8
Figure 8. Disease association of genes involved in many interactions across all metabolic flux phenotypes.
The relevance of multi-phenotype epistasis to human disease was explored by comparing the total number of (A) antagonistic and (B) synergistic interactions across all phenotypes for those yeast genes with a human homolog in OMIM to those yeast genes with a human homolog that is not in OMIM. The distributions of interaction counts are displayed as box-plots with the boxes encompassing the 25th to 75th percentiles, and the line at the median value. Genes with a human homolog in OMIM have more antagonistic and synergistic interactions, with the difference for antagonistic interactions being significant at p<0.05 (Signed-rank test, p = 0.022 (antagonistic), p = 0.071 (synergistic), n1 = 30, n2 = 19).

Similar articles

Cited by

References

    1. Phillips PC. Epistasis - the essential role of gene interactions in the structure and evolution of genetic systems. Nat Rev Genet. 2008;9:855–867. - PMC - PubMed
    1. Guarente L. Synthetic enhancement in gene interaction: a genetic tool come of age. Trends Genet. 1993;9:362–366. - PubMed
    1. Stein A, Aloy P. A molecular interpretation of genetic interactions in yeast. FEBS Lett. In Press, Uncorrected Proof. Available at: http://www.sciencedirect.com/science/article/B6T36-4RW9H0W-9/2/65bd6932e.... Accessed 25 February 2008. - PubMed
    1. Schuldiner M, Collins SR, Thompson NJ, Denic V, Bhamidipati A, et al. Exploration of the Function and Organization of the Yeast Early Secretory Pathway through an Epistatic Miniarray Profile. Cell. 2005;123:507–519. - PubMed
    1. Ye P, Peyser BD, Pan X, Boeke JD, Spencer FA, et al. Gene function prediction from congruent synthetic lethal interactions in yeast. Mol Syst Biol 1 . 2005. Available at: http://dx.doi.org/10.1038/msb4100034. Accessed 4 December 2008. - DOI - PMC - PubMed

Publication types

LinkOut - more resources