. 2011 Feb 10;6(2):e17051.
doi: 10.1371/journal.pone.0017051.

Nocturnin expression is induced by fasting in the white adipose tissue of restricted fed mice

Affiliations

Nocturnin expression is induced by fasting in the white adipose tissue of restricted fed mice

Misty R Gilbert et al. PLoS One. .

Abstract

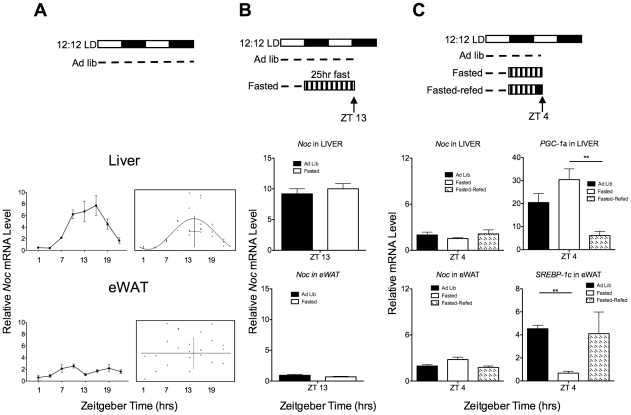
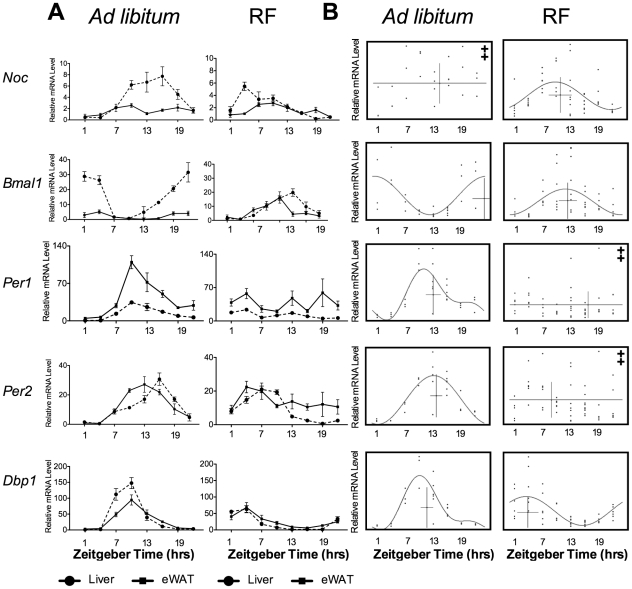
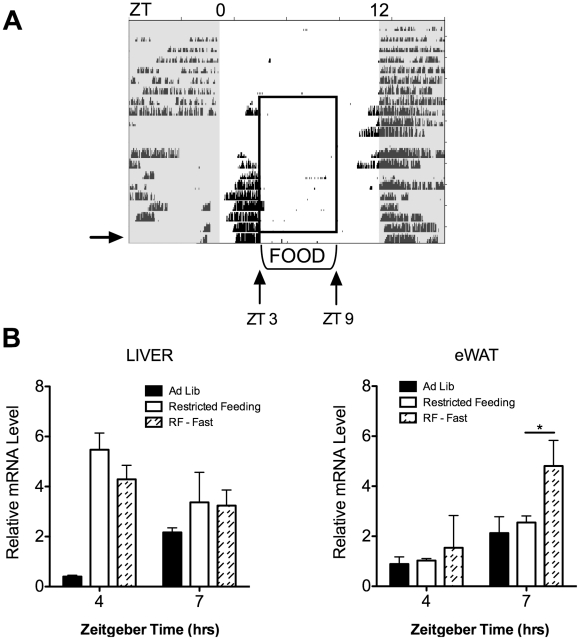
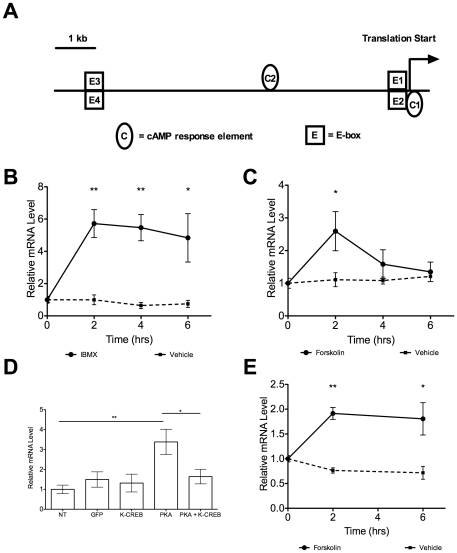
The relationship between circadian clocks and metabolism is intimate and complex and a number of recent studies have begun to reveal previously unknown effects of food and its temporal availability on the clock and the rhythmic transcriptome of peripheral tissues. Nocturnin, a circadian deadenylase, is expressed rhythmically in a wide variety of tissues, but we report here that Nocturnin expression is arrhythmic in epididymal white adipose tissue (eWAT) of mice housed in 12:12 LD with ad libitum access to food. However, Nocturnin expression becomes rhythmic in eWAT of mice placed on restricted feeding. We show here that Nocturnin's rhythmic expression pattern is not dependent upon feeding, nor is it acutely induced by feeding in the liver or eWAT of ad libitum fed mice. However, Nocturnin is acutely induced by the absence of the expected meal in eWAT of restricted fed mice. A rise in cAMP levels also induces Nocturnin expression, suggesting that Nocturnin's induction in eWAT by fasting is likely mediated through the same pathways that activate lipolysis. Therefore, this suggests that Nocturnin plays a role in linking nutrient sensing by the circadian clock to lipid mobilization in the adipocytes.


Conflict of interest statement

Competing Interests: The authors have declared that no competing interests exist.

Figures

Figure 1
Figure 1. Nocturnin expression is not dependent upon or induced by feeding.
(A) Nocturnin expression is not dependent upon feeding. The top panel is a schematic depicting the experimental setup. Open bars represent lights on, and the closed bars represent lights off. The dotted line depicts food availability. Graphs (left) represent the mean relative mRNA level (±SEM) for each time point in liver (top) and eWAT (bottom), n = 3–6. CircWave analysis (right panels of A) shows the corresponding statistical analyses for rhythmicity. In the CircWave graphs, each dot represents the normalized relative mRNA level from the eWAT of an individual mouse. The curve represents the best-fit fourier curve, with the center of gravity (phase) represented by the vertical bar intersecting with the horizontal bar which represents the mean of the entire data set (liver; p≤0.002). Data set for which a fourier curve could not be fitted (eWAT) is indicated by ‡. (B) Nocturnin expression is not induced by fasting. Schematic of fasting experiment (top panel) as described in (A). The bar with vertical stripes represents the fasting period. Graphs represent the mean (±SEM) for each group, n = 4. (C) Nocturnin expression is not induced by feeding after a fast. Schematic representation of experiment is as described in (A) and (B). The solid black bar in the “refed” condition represents the time period in which food was made available after the fast. Gene expression analysis of the liver (middle panel) and eWAT (bottom panel) collected at ZT4 shows that Nocturnin is not induced by feeding after a fast, though the expected changes in expression patterns of Srebp-1c and Pgc-1α were observed (see text). Data represent the mean (±SEM), n = 3 for each group.
Figure 2
Figure 2. Wheel-running actograms of restricted fed or ad libitum fed C57BL/6 mice.
(A) Restricted fed mice. Each horizontal line of the actogram represents a twenty-four hour period, and each tick mark on the graph represents one running-wheel revolution. Lights off are indicated by the shaded areas of the actograms. Mice were habituated to a 12∶12 LD cycle for 7 days with ad libitum access to food. At ZT9 on Day 7 (marked by the arrow), food was removed from the cages. At ZT3, a small bowl containing food was placed in the bottom of the cage. At ZT9 the food was removed. This was repeated daily until the conclusion of the experiment on Day 21. Food availability is marked by the open box. This actogram is a representative example from an individual mouse. (B) Ad libitum fed controls. Actogram is as described in (A). Mice were habituated to a 12∶12 LD cycle for 7 days. On day 8, small bowls of food were placed into the cages, and food was moved in and out of the bowl at ZT3 and ZT9, respectively. Controls were maintained on ad libitum feeding throughout the study, but on day 8 small bowls of food were placed into the cages, and food was moved in and out of the cage in the same manner as the restricted fed mice. Times food bowls were moved in and out are represented by *.
Figure 3
Figure 3. Restricted feeding results in the rhythmic expression of Nocturnin in the epididymal white adipose tissue.
(A) Gene expression analysis conducted on the liver (dashed line) and on the eWAT tissue (solid line) in ad libitum fed mice (left panel) and restricted fed mice (RF, right panel). Data represent the mean (± SEM) of a group for each time point (n = 3–6 per timepoint for the ad libitum condition, and n = 5–9 for the restricted fed condition). Ad libitum expression profiles of Nocturnin shown in 3A are the same data as shown in Figure 1A, and is regraphed here for convenient comparison. (B) CircWave analysis of eWAT gene expression data from (A) from ad libitum (left panel) and restricted fed mice (RF, right panel). The graphs are as described in Figure 1A. For all gene expression values, except those graphs marked with ‡, p-values <0.002. ‡ marks the data for which no curve could be fit. Note that the Nocturnin ad libitum data from liver and eWAT in this figure are the same data as shown in Figure 1A and are shown again here for direct comparison.
Figure 4
Figure 4. Nocturnin is induced by fasting in eWAT tissue of restricted fed mice.
(A) Schematic representation of feeding paradigm and absence of meal on the thirteenth day of restricted feeding. Actogram is as described in Figure 2, and is a representative wheel running actogram of restricted fed mice. Mice were habituated to a 12∶12 LD cycle for seven days, restricted feeding began on Day 8. On the 13th day of restricted feeding (indicated by the arrow), mice were not given the expected meal at ZT3, the condition labeled as RF-Fast. (B) Gene expression analysis of the liver (left panel) and the epididymal white adipose tissue (eWAT, right panel) reveal that Nocturnin is induced by the absence of the meal in eWAT only. The data from the ad libitum control group and from the restricted fed group (RF) are the same as from Figure 2 and has been re-graphed here for comparison. Data represent the mean of the group (±SEM); for each time point, n = 3 for the ad libitum group, n = 6 for the restricted-fed group, and n = 4 for the RF-fasted group. *  =  t-test, p-value  = 0.019.
Figure 5
Figure 5. Nocturnin is induced by a rise in cAMP in NIH-3T3 fibroblasts and in 3T3-L1 adipocytes.
(A) Schematic representation of highly conserved putative transcription factor binding sites in the 10 kb region upstream of Nocturnin's translation start site. C =  cAMP response element binding protein (CRE) sites. E =  E-box elements. Locations of the CRE sites are C1 −29 bp and C2+3,016 bp. (B) Nocturnin is induced approximately 4.5 fold by IBMX (solid line) in NIH3T3 fibroblasts. No induction of Nocturnin was observed in the vehicle treated cells (dashed line). Data represent mean (± SEM), normalized to Cyclophilin B. n = 4 for each time point. P-value determined by t-test assuming equal variances, two-way p-value reported. ** p-value <0.002; * p-value <0.03. (C) Nocturnin is induced approximately 2.5 fold by forskolin (solid line) in NIH3T3 fibroblasts. The dashed line represents data from vehicle treated cells. Data represent mean (± SEM), normalized to Cyclophilin B. n = 3 for each time point. P-value determined by t-test assuming equal variances, two-way p-value reported. * p-value <0.03. (D) Transient transfection assay of NIH3T3 fibroblasts showing Nocturnin is induced by the overexpression of PKA in a CREB-dependent manner. Data represent the mean (± SEM), n = 6 for each group. T-test assuming equal variances performed, p-value reported. **  =  p-value <0.01; *  =  p-value <0.04. NT =  non-transfected; GFP =  GFP transfected; K-CREB =  pCMV-KCREB (dominant negative) alone transfected; PKA =  pCMV-PKA transfected; PKA + K-CREB  =  pCMV-PKA and dominant negative pCMV-KCREB were cotransfected. (E) Nocturnin is induced approximately 2 fold by forskolin (solid line) in mature 3T3-L1 adipocytes. The dashed line represents data from vehicle treated cells. Data represent the mean (± SEM), n = 3. **  =  p-value 0.0009, and *  =  p-value 0.036. Data were normalized to Cyclophilin B.

Similar articles

Cited by

References

    1. Stephan FK. The “other” circadian system: food as a Zeitgeber. J Biol Rhythms. 2002;17:284–292. - PubMed
    1. Stokkan KA, Yamazaki S, Tei H, Sakaki Y, Menaker M. Entrainment of the circadian clock in the liver by feeding. Science. 2001;291:490–493. - PubMed
    1. Damiola F, Le Minh N, Preitner N, Kornmann B, Fleury-Olela F, et al. Restricted feeding uncouples circadian oscillators in peripheral tissues from the central pacemaker in the suprachiasmatic nucleus. Genes Dev. 2000;14:2950–2961. - PMC - PubMed
    1. Green CB, Takahashi JS, Bass J. The meter of metabolism. Cell. 2008;134:728–742. - PMC - PubMed
    1. Rudic RD, McNamara P, Curtis AM, Boston RC, Panda S, et al. BMAL1 and CLOCK, two essential components of the circadian clock, are involved in glucose homeostasis. PLoS Biol. 2004;2:e377. - PMC - PubMed

Publication types