

Analysis of the transcriptional program of developing induced regulatory T cells
- PMID: 21347372
- PMCID: PMC3036712
- DOI: 10.1371/journal.pone.0016913
Analysis of the transcriptional program of developing induced regulatory T cells
Abstract
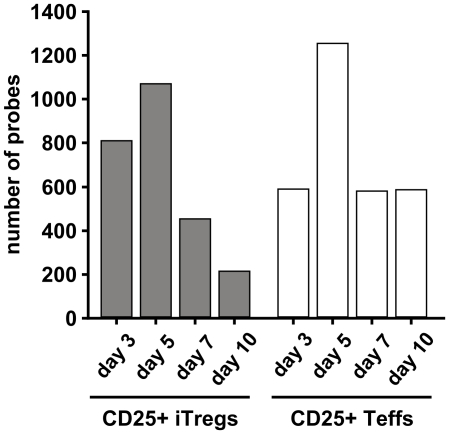
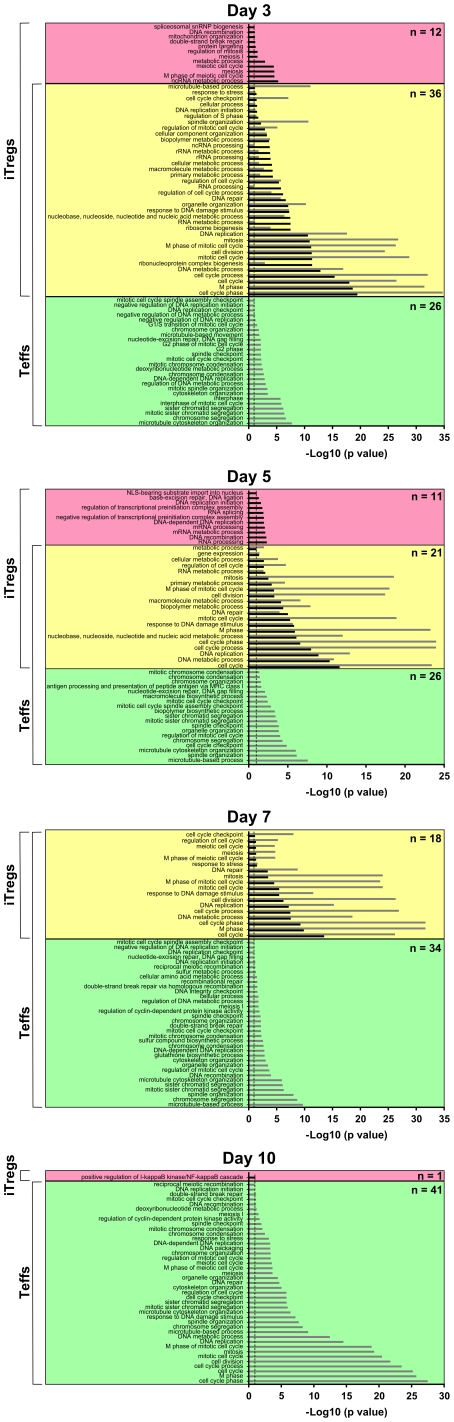
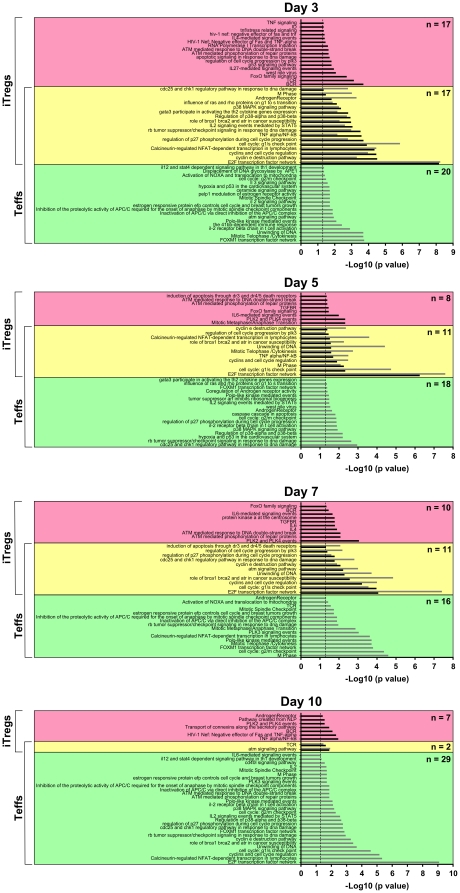
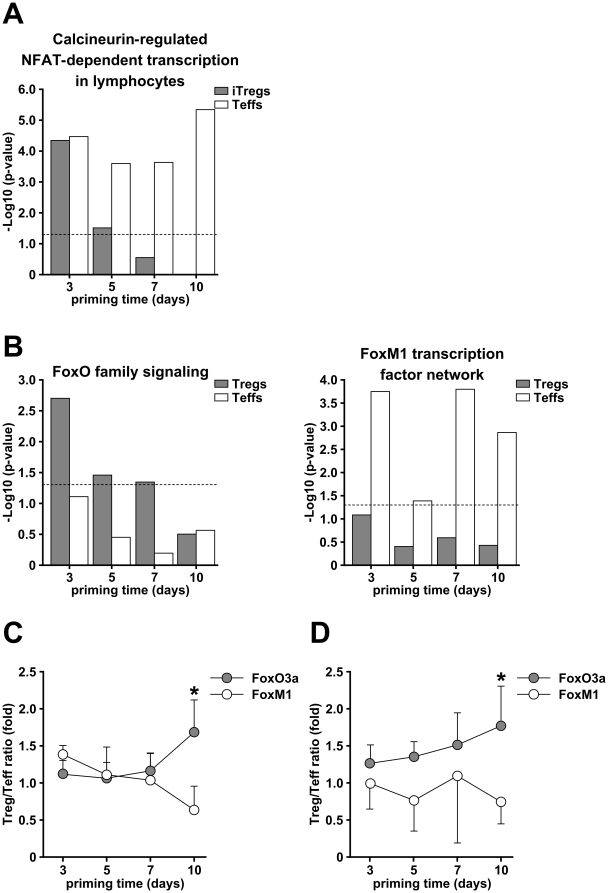
CD25+ regulatory T cells develop in the thymus (nTregs), but may also be generated in the periphery upon stimulation of naive CD4 T cells under appropriate conditions (iTregs). To gain insight into the mechanisms governing iTreg development, we performed longitudinal transcriptional profiling of CD25+ T cells during their differentiation from uncommitted naive CD4 T cells. Microarray analysis of mRNA from CD25+ iTregs early after stimulation revealed expression of genes involved in cell cycle progression and T cell activation, which largely overlapped with genes expressed in CD25+ effector T cells (Teffs) used as a control. Whereas expression of these genes remained elevated in Teffs, it declined gradually in developing iTregs, resulting in a more quiescent phenotype in mature iTregs. A similar pattern of kinetics was observed for biological processes and for intracellular pathways over-represented within the expressed genes. A maximum dichotomy of transcriptional activity between iTregs and Teffs was reached at late stages of their maturation. Of interest, members of the FoxO and FoxM1 transcription factor family pathways exhibited a reciprocal expression pattern in iTregs and Teffs, suggesting a role of these transcription factors in determining T cell fate.
Conflict of interest statement
Figures


Similar articles
-
In vitro-expanded CD4(+)CD25(high)Foxp3(+) regulatory T cells controls corneal allograft rejection.Hum Immunol. 2012 Nov;73(11):1061-7. doi: 10.1016/j.humimm.2012.08.014. Epub 2012 Aug 29. Hum Immunol. 2012. PMID: 22939904
-
Distinct regulatory roles of transforming growth factor-beta and interleukin-4 in the development and maintenance of natural and induced CD4+ CD25+ Foxp3+ regulatory T cells.Immunology. 2009 Sep;128(1 Suppl):e670-8. doi: 10.1111/j.1365-2567.2009.03060.x. Epub 2009 Jan 24. Immunology. 2009. PMID: 19740328 Free PMC article.
-
Natural and TGF-beta-induced Foxp3(+)CD4(+) CD25(+) regulatory T cells are not mirror images of each other.Trends Immunol. 2008 Sep;29(9):429-35. doi: 10.1016/j.it.2008.06.005. Epub 2008 Aug 3. Trends Immunol. 2008. PMID: 18676178 Review.
-
Human in vitro-induced regulatory T cells display Dlgh1dependent and PKC-θ restrained suppressive activity.Sci Rep. 2017 Jun 26;7(1):4258. doi: 10.1038/s41598-017-04053-5. Sci Rep. 2017. PMID: 28652577 Free PMC article.
-
Single-Cell Sequencing Reveals the Transcriptome and TCR Characteristics of pTregs and in vitro Expanded iTregs.Front Immunol. 2021 Mar 31;12:619932. doi: 10.3389/fimmu.2021.619932. eCollection 2021. Front Immunol. 2021. PMID: 33868236 Free PMC article.
Cited by
-
Project-based learning course on metabolic network modelling in computational systems biology.PLoS Comput Biol. 2022 Jan 27;18(1):e1009711. doi: 10.1371/journal.pcbi.1009711. eCollection 2022 Jan. PLoS Comput Biol. 2022. PMID: 35085230 Free PMC article.
-
The Streptomyces Metabolite Thiostrepton Inhibits Regulatory T Cell Differentiation and Function to Boost Antitumor Immune Responses.Eur J Immunol. 2025 Aug;55(8):e70035. doi: 10.1002/eji.70035. Eur J Immunol. 2025. PMID: 40820379 Free PMC article.
-
Integrative computational approach identifies drug targets in CD4+ T-cell-mediated immune disorders.NPJ Syst Biol Appl. 2021 Jan 22;7(1):4. doi: 10.1038/s41540-020-00165-3. NPJ Syst Biol Appl. 2021. PMID: 33483502 Free PMC article.
-
Dependence on nuclear factor of activated T-cells (NFAT) levels discriminates conventional T cells from Foxp3+ regulatory T cells.Proc Natl Acad Sci U S A. 2012 Oct 2;109(40):16258-63. doi: 10.1073/pnas.1203870109. Epub 2012 Sep 18. Proc Natl Acad Sci U S A. 2012. PMID: 22991461 Free PMC article.
-
Regulatory T cells in arterivirus and coronavirus infections: do they protect against disease or enhance it?Viruses. 2012 May;4(5):833-46. doi: 10.3390/v4050833. Epub 2012 May 15. Viruses. 2012. PMID: 22754651 Free PMC article. Review.
References
-
- Sakaguchi S, Sakaguchi N, Asano M, Itoh M, Toda M. Immunologic self-tolerance maintained by activated T cells expressing IL-2 receptor alpha-chains (CD25). Breakdown of a single mechanism of self-tolerance causes various autoimmune diseases. J Immunol. 1995;155:1151–1164. - PubMed
-
- Shevach EM. CD4+ CD25+ suppressor T cells: more questions than answers. Nat Rev Immunol. 2002;2:389–400. - PubMed
-
- von Boehmer H. Mechanisms of suppression by suppressor T cells. Nat Immunol. 2005;6:338–344. - PubMed
-
- Sakaguchi S. Naturally arising CD4+ regulatory t cells for immunologic self-tolerance and negative control of immune responses. Annu Rev Immunol. 2004;22:531–562. - PubMed
-
- Ziegler SF. FOXP3: of mice and men. Annu Rev Immunol. 2006;24:209–226. - PubMed
Publication types
MeSH terms
Substances
LinkOut - more resources
Full Text Sources
Molecular Biology Databases
Research Materials
Miscellaneous
