. 2011 Feb 9;6(2):e16955.
doi: 10.1371/journal.pone.0016955.

Behaviour of telomere and telomerase during aging and regeneration in zebrafish

Affiliations

Behaviour of telomere and telomerase during aging and regeneration in zebrafish

Monique Anchelin et al. PLoS One. .

Abstract

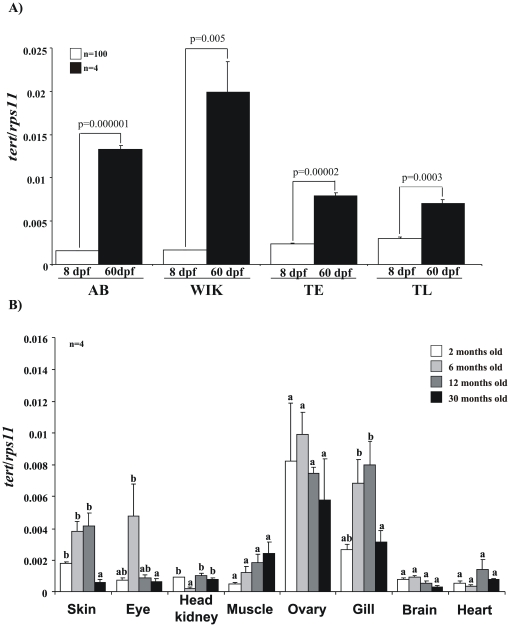
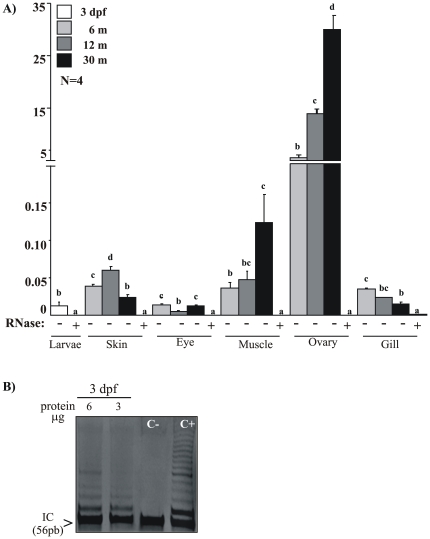
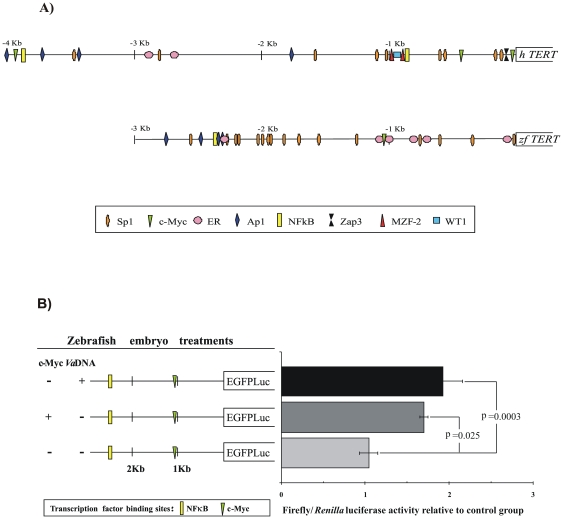
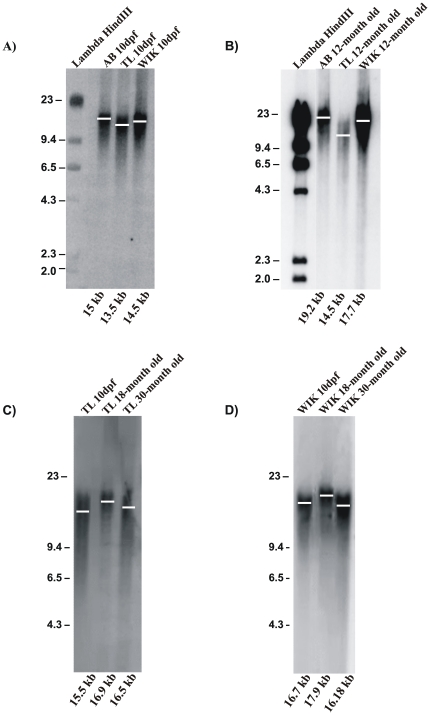
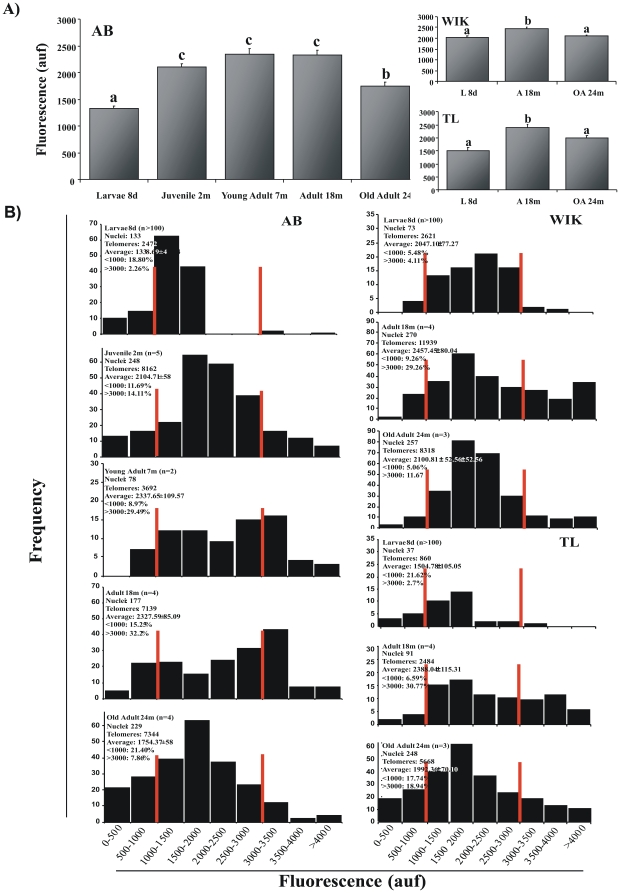
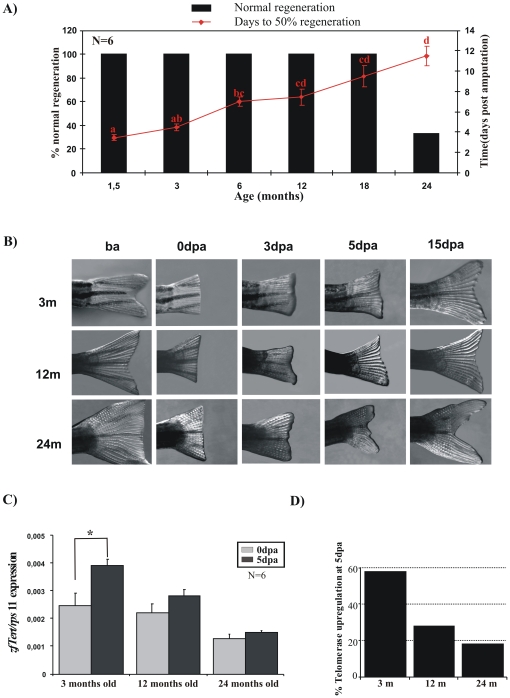
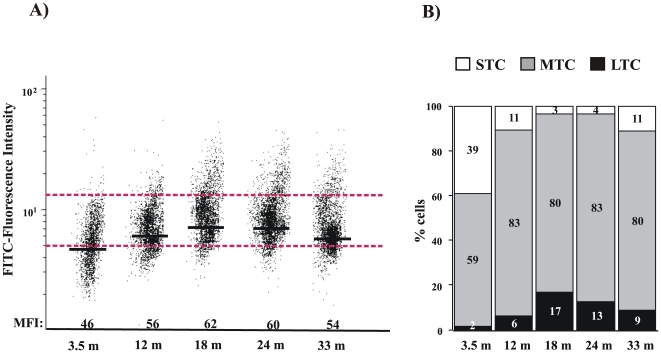
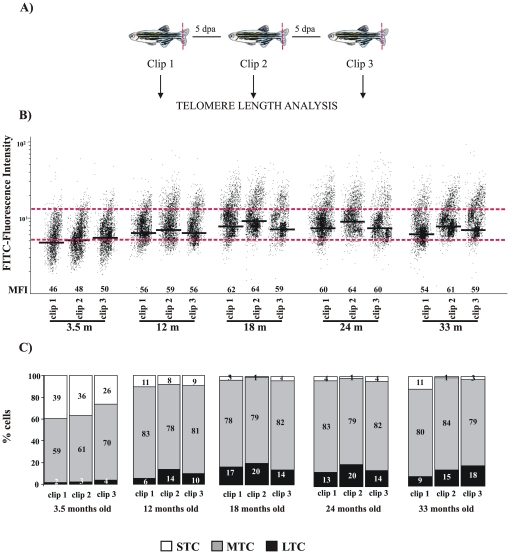
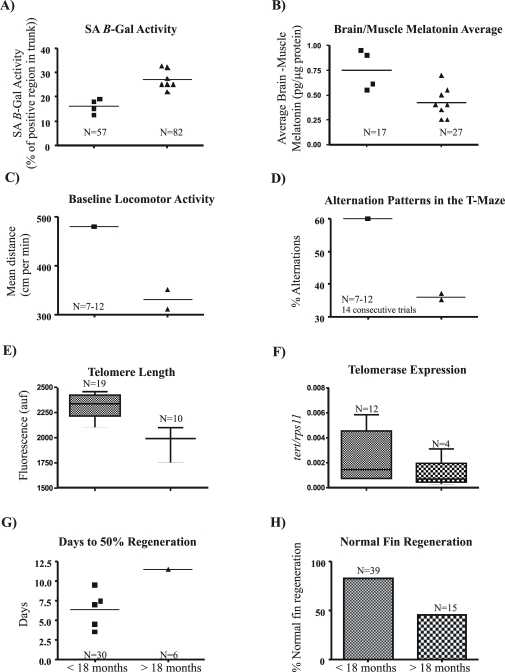
Telomere length and telomerase activity are important factors in the pathobiology of human diseases. Age-related diseases and premature aging syndromes are characterized by short telomeres, which can compromise cell viability, whereas tumour cells can prevent telomere loss by aberrantly upregulating telomerase. The zebrafish (Danio rerio) offers multiple experimental manipulation advantages over other vertebrate models and, therefore, it has been recently considered as a potential model for aging, cancer, and regeneration studies. However, it has only partially been exploited to shed light on these fundamental biological processes. The aim of this study was, therefore, to investigate telomere length and telomerase expression and activity in different strains of zebrafish obtained from different stock centres to determine whether they undergo any changes during aging and regeneration. We found that although both telomerase expression and telomere length increased from embryo to adulthood stages, they drastically declined in aged fish despite telomerase activity was detected in different tissues of old fish. In addition, we observed a weaker upregulation of telomerase expression in regenerating fins of old fish, which well correlates with their impaired regeneration capacity. Strikingly, telomeres were elongated or maintained during the fin regeneration process at all ages and after repeated amputations, likely to support high cell proliferation rates. We conclude that the expression of telomerase and telomere length are closely related during the entire life cycle of the fish and that these two parameters can be used as biomarkers of aging in zebrafish. Our results also reveal a direct relationship between the expression of telomerase, telomere length and the efficiency of tissue regeneration.


Conflict of interest statement

Competing Interests: The authors have declared that no competing interests exist.

Figures

Figure 1
Figure 1. Dynamic of TERT gene expression in the zebrafish.
The mRNA levels of tert gene were determined by real-time RT-PCR in larval and juvenile stages of the indicated genotypes (A) and in different tissues of 2–30 month-old fish of the AB genotype. Gene expression is normalized against rps11. Each bar represents the mean ± S.E. from 100 pooled animals for larvae and 4 individual fish for all the rest (A,B) and triplicate samples.
Figure 2
Figure 2. Very old fish have telomerase activity.
Telomerase activity was measured quantitatively and qualitatively in whole zebrafish embryos (3 days post-fertilization, dpf, n = 100) and in several organs from adults with different ages (6, 12 and 30 months old, n = 4). A, Q-TRAP assay using 1 µg of protein extract. Results are expressed as the mean value ± S.E. from triplicate samples relative to telomerase-positive cells. Different letters denote statistically significant differences between different ages of each sample according to a Tukey test. B, TRAP assay using protein extract from whole zebrafish embryos. A ladder of bands indicates the presence of telomerase activity. The lowest band (56 pb) is the internal control (IC). Lanes C− and C+ correspond to telomerase- negative and positive controls, respectively. In all cases, to confirm the specificity of the assay, a negative control is included for each sample, treated with 1 µg of RNAse at 37°C for 20 min. The Q-TRAP assay was also performed using 0.1 µg of protein extract and the same relative results were obtained (data not shown).
Figure 3
Figure 3. A, Putative regulatory elements of human and zebrafish TERT promoter.
The putative binding sites of different transcription factors in the zebrafish telomerase promoter were determined by using the TESS (Transcription Element Search System): http://www.cbil.upenn.edu/cgi-bin/tess/tess. The information about the putative transcription factor binding site in the human telomerase promoter was previously described by Pericuesta et al. 2006. B, The transcription factors c-Myc and NFkB regulate the expression of the zebrafish TERT gene. The zfTERT promoter-EGFPLuc reporter constructs are shown on the left, while the relative luciferase activity of each construct is shown on the right. Each bar represents the mean ± S.E. from triplicate samples. Different letters denote statistically significant differences between the group according to a Tukey test. A promoterless construct and a Renilla luciferase expression vector were used in all cases as blank and internal controls, respectively.
Figure 4
Figure 4. Dynamic of telomere length in zebrafish assayed by TRF.
A representative TRF shows telomere length of different zebrafish background from larvae (A) and adults (B), and in TL (C) and WIK (D) zebrafish genotypes throughout their life cycles. Telomere length (Kb) is calculated using a quantitative algorithm involving the signal intensity of each telomere smear and the migration of the lambda HindIII ladder (lane 1). 3–5 independent TRF experiments were perform. We used a zebrafish embryos (10 dpf, n = 100) and adult fish for each strain with different ages (12, 18 and 30 months old, n = 3–4).
Figure 5
Figure 5. Dynamic of telomere length assayed by Q-FISH.
A, Graph showing the mean telomeric fluorescence values. Data are mean values ± S.E. and statistical significance was assessed using the Tukey test (p<0.05). B, Histograms showing telomere fluorescence frequencies. The red lines demarcate both the shortest (<1000 auf) and the longest telomere percentage (>3000 auf) clearly illustrating telomere lengthening throughout the life cycle to adulthood and shortening in old age.
Figure 6
Figure 6. Old fish show impaired regeneration response.
A, Percent fin regeneration was determined based on the area regrowth divided by the original fin area, n = 6 (ba: before amputation, dpa: days post-amputation). Black bars show normal caudal fin regeneration and red line indicate the days to reach 50% of the regeneration. B, Representative image of the fin regeneration assay. C, Analysis of TERT expression in regenerating fin 0 and 5 dpa, assayed by real time RT-PCR. Gene expression is normalized against rps11. Data are mean values ± S.E. D. Percentage of telomerase upregulation at 5 dpa.
Figure 7
Figure 7. Dynamic of telomere length in zebrafish caudal fin assayed by Flow-FISH.
A, Representation of the zebrafish caudal fin cells distribution (clip 1) according to their telomere length., Medium Fluorescence Intensity (MFI) is indicated for each age, (n = 5). The same trend was observed in the three independent experiments. B, Graphic representation of the percentage of cells with long telomere (LTC), medium telomere (MTC), and short telomere (STC), delimited by dotted red lines, from clip1 at different ages.
Figure 8
Figure 8. Behaviour of telomere length during fin regeneration by Flow-FISH assay.
A, Experimental design of the Flow-FISH assay. Clip 1 (1st fin excision), clip 2 (2nd excision) and clip 3 (3rd excision). B, Representation of the zebrafish caudal fin cells distribution (clip 1, clip2 and clip3) according to their telomere length. MFI is indicated for each age, (n = 5). The same trend was observed in the three independent experiments C, Graphic representation of the percentage of cells with long telomere (LTC), medium telomere (MTC), and short telomere (STC), delimited by dotted red lines, from clip1, clip 2 and clip 3, at different ages.
Figure 9
Figure 9. Potential aging biomarkers in the zebrafish.
All the biomarkers shown are able to discriminate two age groups. The data were collected from different studies cited in our manuscript. We show the average for each aging marker. The data was divided in two groups:. fish younger than 18 months are all depicted with squares and fish older than 18 months with a triangle. The total fish number used for these two groups was indicated. A, β-Gal activity marker (Kishi et al. 2008). B, Brain/Muscle Melatonin (Tsai et al. 2007, average of melatonin levels in muscle and brain of different age fish groups). C–D, Changes in cognitive function , C, Baseline locomotors activity level, D, Alternation pattern for the choice of the short arms in the T-maze. E, Telomere length (our data). F, Telomere expression (this manuscript). G–H, Regeneration experiments [63 and this manuscript].

Similar articles

Cited by

References

    1. Lieschke GJ, Currie PD. Animal models of human disease: zebrafish swim into view. Nature Genet. 2007;8:353–367. - PubMed
    1. Feitsma H, Cuppen E. Zebrafish as a cancer model. Mo.l Cancer Res. 2008;6:685–694. - PubMed
    1. Gerhard GS, Cheng KC. A call to fins! Zebrafish as a gerontological model. Aging Cell. 2002;1:104–111. - PubMed
    1. Gerhard GS. Small laboratory fish as models for aging research. Ageing Res Rev. 2007 May; 2007;6(1):64–72. - PubMed
    1. Kishi S, Uchiyama J, Baughman AM, Goto T, Lin MC, et al. The zebrafish as a vertebrate model of functional aging and very gradual senescence. Exp Gerontol. 2003;38:777–786. - PubMed

Publication types

MeSH terms

LinkOut - more resources