

Electroporation-induced electrosensitization
- PMID: 21347394
- PMCID: PMC3036735
- DOI: 10.1371/journal.pone.0017100
Electroporation-induced electrosensitization
Abstract
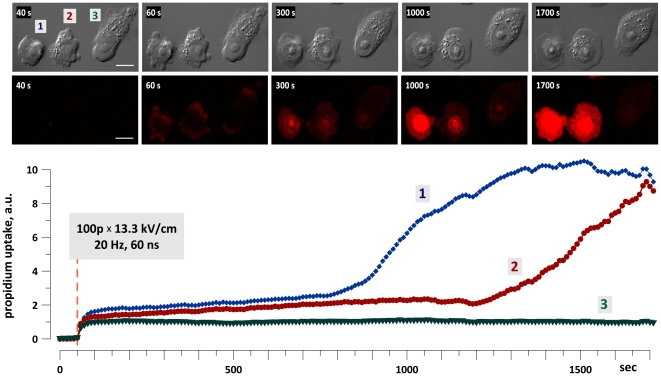
Background: Electroporation is a method of disrupting the integrity of cell membrane by electric pulses (EPs). Electrical modeling is widely employed to explain and study electroporation, but even most advanced models show limited predictive power. No studies have accounted for the biological consequences of electroporation as a factor that alters the cell's susceptibility to forthcoming EPs.
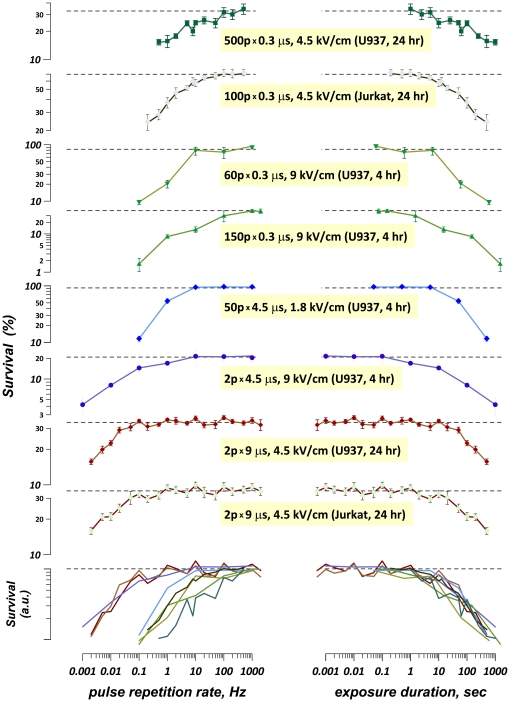
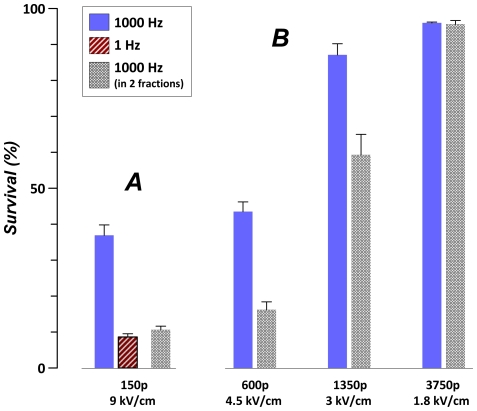
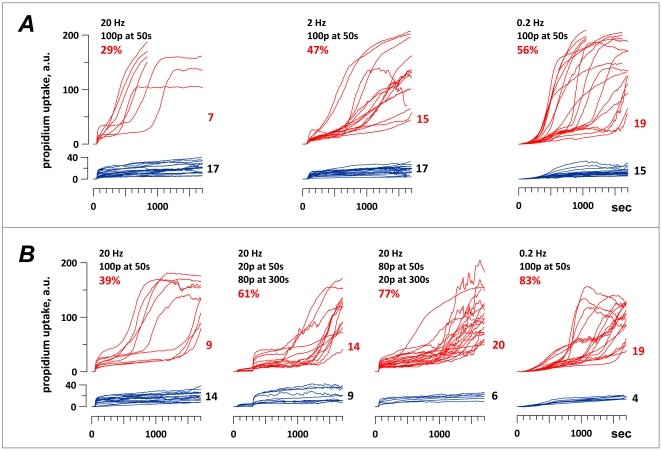
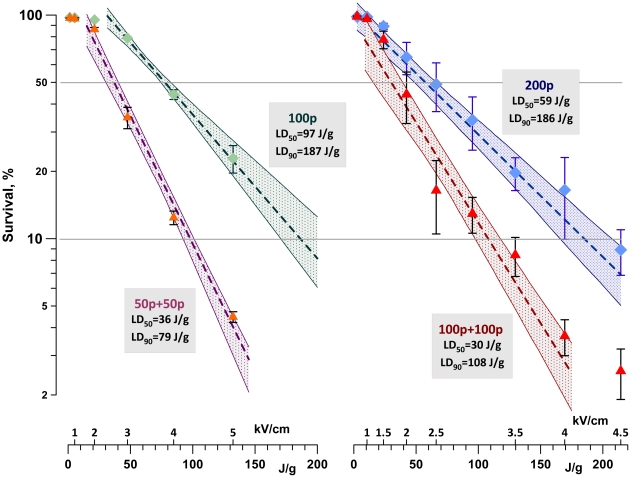
Methodology/principal findings: We focused first on the role of EP rate for membrane permeabilization and lethal effects in mammalian cells. The rate was varied from 0.001 to 2,000 Hz while keeping other parameters constant (2 to 3,750 pulses of 60-ns to 9-µs duration, 1.8 to 13.3 kV/cm). The efficiency of all EP treatments was minimal at high rates and started to increase gradually when the rate decreased below a certain value. Although this value ranged widely (0.1-500 Hz), it always corresponded to the overall treatment duration near 10 s. We further found that longer exposures were more efficient irrespective of the EP rate, and that splitting a high-rate EP train in two fractions with 1-5 min delay enhanced the effects severalfold.
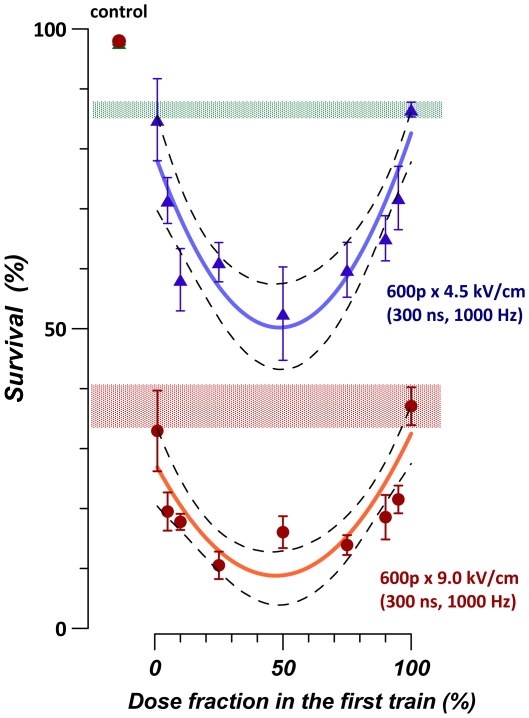
Conclusions/significance: For varied experimental conditions, EPs triggered a delayed and gradual sensitization to EPs. When a portion of a multi-pulse exposure was delivered to already sensitized cells, the overall effect markedly increased. Because of the sensitization, the lethality in EP-treated cells could be increased from 0 to 90% simply by increasing the exposure duration, or the exposure dose could be reduced twofold without reducing the effect. Many applications of electroporation can benefit from accounting for sensitization, by organizing the exposure either to maximize sensitization (e.g., for sterilization) or, for other applications, to completely or partially avoid it. In particular, harmful side effects of electroporation-based therapies (electrochemotherapy, gene therapies, tumor ablation) include convulsions, pain, heart fibrillation, and thermal damage. Sensitization can potentially be employed to reduce these side effects while preserving or increasing therapeutic efficiency.
Conflict of interest statement
Figures
Similar articles
-
Facilitation of electroporative drug uptake and cell killing by electrosensitization.J Cell Mol Med. 2013 Jan;17(1):154-9. doi: 10.1111/j.1582-4934.2012.01658.x. Epub 2013 Jan 11. J Cell Mol Med. 2013. PMID: 23305510 Free PMC article.
-
Modeling a Conventional Electroporation Pulse Train: Decreased Pore Number, Cumulative Calcium Transport and an Example of Electrosensitization.IEEE Trans Biomed Eng. 2016 Mar;63(3):571-80. doi: 10.1109/TBME.2015.2466234. Epub 2015 Aug 20. IEEE Trans Biomed Eng. 2016. PMID: 26302502
-
Electrosensitization assists cell ablation by nanosecond pulsed electric field in 3D cultures.Sci Rep. 2016 Mar 18;6:23225. doi: 10.1038/srep23225. Sci Rep. 2016. PMID: 26987779 Free PMC article.
-
Therapeutic perspectives of high pulse repetition rate electroporation.Bioelectrochemistry. 2024 Apr;156:108629. doi: 10.1016/j.bioelechem.2023.108629. Epub 2023 Dec 21. Bioelectrochemistry. 2024. PMID: 38159429 Review.
-
Does the shape of the electric pulse matter in electroporation?Front Oncol. 2022 Sep 14;12:958128. doi: 10.3389/fonc.2022.958128. eCollection 2022. Front Oncol. 2022. PMID: 36185267 Free PMC article. Review.
Cited by
-
Tumor cell death after electrotransfer of plasmid DNA is associated with cytosolic DNA sensor upregulation.Oncotarget. 2018 Apr 10;9(27):18665-18681. doi: 10.18632/oncotarget.24816. eCollection 2018 Apr 10. Oncotarget. 2018. PMID: 29721152 Free PMC article.
-
Electrosensitization Increases Antitumor Effectiveness of Nanosecond Pulsed Electric Fields In Vivo.Technol Cancer Res Treat. 2017 Dec;16(6):987-996. doi: 10.1177/1533034617712397. Epub 2017 Jun 6. Technol Cancer Res Treat. 2017. PMID: 28585492 Free PMC article.
-
Cell permeabilization and inhibition of voltage-gated Ca(2+) and Na(+) channel currents by nanosecond pulsed electric field.Bioelectromagnetics. 2012 Jul;33(5):394-404. doi: 10.1002/bem.21696. Epub 2011 Dec 28. Bioelectromagnetics. 2012. PMID: 22213081 Free PMC article.
-
Pulsed Electromagnetic Field Assisted in vitro Electroporation: A Pilot Study.Sci Rep. 2016 Sep 16;6:33537. doi: 10.1038/srep33537. Sci Rep. 2016. PMID: 27634482 Free PMC article.
-
Primary pathways of intracellular Ca(2+) mobilization by nanosecond pulsed electric field.Biochim Biophys Acta. 2013 Mar;1828(3):981-9. doi: 10.1016/j.bbamem.2012.11.032. Epub 2012 Dec 5. Biochim Biophys Acta. 2013. PMID: 23220180 Free PMC article.
References
-
- Sersa G, Kranjc S, Scancar J, Krzan M, Cemazar M. Electrochemotherapy of Mouse Sarcoma Tumors Using Electric Pulse Trains with Repetition Frequencies of 1 Hz and 5 kHz. The Journal of Membrane Biology. 2010;236:155–162. - PubMed
-
- Raeisi E, Firoozabadi SMP, Hajizadeh S, Rajabi H, Hassan ZM. The Effect of High-Frequency Electric Pulses on Tumor Blood Flow In Vivo. The Journal of Membrane Biology. 2010;236:163–166. - PubMed
-
- Ball C, Thomson KR, Kavnoudias H. Irreversible Electroporation. Anesthesia & Analgesia. 2010;110:1305–1309. - PubMed
-
- Rubinsky J, Onik G, Mikus P, Rubinsky B. Optimal Parameters for the Destruction of Prostate Cancer Using Irreversible Electroporation. The Journal of Urology. 2008;180:2668–2674. - PubMed
Publication types
MeSH terms
Substances
Grants and funding
LinkOut - more resources
Full Text Sources
Other Literature Sources
Miscellaneous
