Role of cell-to-cell variability in activating a positive feedback antiviral response in human dendritic cells
- PMID: 21347441
- PMCID: PMC3035661
- DOI: 10.1371/journal.pone.0016614
Role of cell-to-cell variability in activating a positive feedback antiviral response in human dendritic cells
Abstract
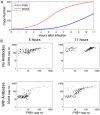
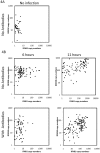
In the first few hours following Newcastle disease viral infection of human monocyte-derived dendritic cells, the induction of IFNB1 is extremely low and the secreted type I interferon response is below the limits of ELISA assay. However, many interferon-induced genes are activated at this time, for example DDX58 (RIGI), which in response to viral RNA induces IFNB1. We investigated whether the early induction of IFNBI in only a small percentage of infected cells leads to low level IFN secretion that then induces IFN-responsive genes in all cells. We developed an agent-based mathematical model to explore the IFNBI and DDX58 temporal dynamics. Simulations showed that a small number of early responder cells provide a mechanism for efficient and controlled activation of the DDX58-IFNBI positive feedback loop. The model predicted distributions of single cell responses that were confirmed by single cell mRNA measurements. The results suggest that large cell-to-cell variation plays an important role in the early innate immune response, and that the variability is essential for the efficient activation of the IFNB1 based feedback loop.
Conflict of interest statement
Figures


Similar articles
-
A common polymorphism in the caspase recruitment domain of RIG-I modifies the innate immune response of human dendritic cells.J Immunol. 2010 Jul 1;185(1):424-32. doi: 10.4049/jimmunol.0903291. Epub 2010 May 28. J Immunol. 2010. PMID: 20511549 Free PMC article.
-
Single-cell analysis shows that paracrine signaling by first responder cells shapes the interferon-β response to viral infection.Sci Signal. 2015 Feb 10;8(363):ra16. doi: 10.1126/scisignal.2005728. Sci Signal. 2015. PMID: 25670204
-
Chromosome-specific and noisy IFNB1 transcription in individual virus-infected human primary dendritic cells.Nucleic Acids Res. 2007;35(15):5232-41. doi: 10.1093/nar/gkm557. Epub 2007 Aug 2. Nucleic Acids Res. 2007. PMID: 17675303 Free PMC article.
-
Power-laws in interferon-B mRNA distribution in virus-infected dendritic cells.Biophys J. 2009 Oct 7;97(7):1984-9. doi: 10.1016/j.bpj.2009.05.067. Biophys J. 2009. PMID: 19804729 Free PMC article.
-
Signaling through RIG-I and type I interferon receptor: Immune activation by Newcastle disease virus in man versus immune evasion by Ebola virus (Review).Int J Mol Med. 2015 Jul;36(1):3-10. doi: 10.3892/ijmm.2015.2213. Epub 2015 May 18. Int J Mol Med. 2015. PMID: 25998621 Review.
Cited by
-
Interferon-β induction heterogeneity during KSHV infection is correlated to expression and activation of enhanceosome transcription factors other than IRF3.bioRxiv [Preprint]. 2025 Jul 23:2024.12.22.629998. doi: 10.1101/2024.12.22.629998. bioRxiv. 2025. PMID: 39763726 Free PMC article. Preprint.
-
Replication defective viral genomes exploit a cellular pro-survival mechanism to establish paramyxovirus persistence.Nat Commun. 2017 Oct 6;8(1):799. doi: 10.1038/s41467-017-00909-6. Nat Commun. 2017. PMID: 28986577 Free PMC article.
-
Multi-scale stochastic simulation of diffusion-coupled agents and its application to cell culture simulation.PLoS One. 2011;6(12):e29298. doi: 10.1371/journal.pone.0029298. Epub 2011 Dec 21. PLoS One. 2011. PMID: 22216238 Free PMC article.
-
Single-cell analysis of early antiviral gene expression reveals a determinant of stochastic IFNB1 expression.Integr Biol (Camb). 2017 Nov 13;9(11):857-867. doi: 10.1039/c7ib00146k. Integr Biol (Camb). 2017. PMID: 29098213 Free PMC article.
-
Human Dendritic Cell Response Signatures Distinguish 1918, Pandemic, and Seasonal H1N1 Influenza Viruses.J Virol. 2015 Oct;89(20):10190-205. doi: 10.1128/JVI.01523-15. Epub 2015 Jul 29. J Virol. 2015. PMID: 26223639 Free PMC article.
References
Publication types
MeSH terms
Substances
Grants and funding
LinkOut - more resources
Full Text Sources

