Remodeling of the metabolome during early frog development
- PMID: 21347444
- PMCID: PMC3035664
- DOI: 10.1371/journal.pone.0016881
Remodeling of the metabolome during early frog development
Abstract
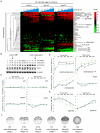
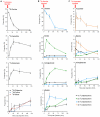
A rapid series of synchronous cell divisions initiates embryogenesis in many animal species, including the frog Xenopus laevis. After many of these cleavage cycles, the nuclear to cytoplasmic ratio increases sufficiently to somehow cause cell cycles to elongate and become asynchronous at the mid-blastula transition (MBT). We have discovered that an unanticipated remodeling of core metabolic pathways occurs during the cleavage cycles and the MBT in X. laevis, as evidenced by widespread changes in metabolite abundance. While many of the changes in metabolite abundance were consistently observed, it was also evident that different female frogs laid eggs with different levels of at least some metabolites. Metabolite tracing with heavy isotopes demonstrated that alanine is consumed to generate energy for the early embryo. dATP pools were found to decline during the MBT and we have confirmed that maternal pools of dNTPs are functionally exhausted at the onset of the MBT. Our results support an alternative hypothesis that the cell cycle lengthening at the MBT is triggered not by a limiting maternal protein, as is usually proposed, but by a decline in dNTP pools brought about by the exponentially increasing demands of DNA synthesis.
Conflict of interest statement
Figures


Similar articles
-
Chk1 Inhibition of the Replication Factor Drf1 Guarantees Cell-Cycle Elongation at the Xenopus laevis Mid-blastula Transition.Dev Cell. 2017 Jul 10;42(1):82-96.e3. doi: 10.1016/j.devcel.2017.06.010. Dev Cell. 2017. PMID: 28697335 Free PMC article.
-
Chk1 is activated at the midblastula transition in Xenopus laevis embryos independently of DNA content and the cyclin E/Cdk2 developmental timer.Cell Cycle. 2008 Apr 15;7(8):1112-6. doi: 10.4161/cc.7.8.5755. Epub 2008 Feb 11. Cell Cycle. 2008. PMID: 18414041
-
Altered expression of Chk1 disrupts cell cycle remodeling at the midblastula transition in Xenopus laevis embryos.Cell Cycle. 2004 Feb;3(2):212-7. Cell Cycle. 2004. PMID: 14712091
-
Regulation of the mid-blastula transition in amphibians.Dev Biol (N Y 1985). 1988;5:209-25. doi: 10.1007/978-1-4615-6817-9_7. Dev Biol (N Y 1985). 1988. PMID: 3077975 Review.
-
Cell cycles during early steps of amphibian embryogenesis: A review.Biosystems. 2018 Nov;173:100-103. doi: 10.1016/j.biosystems.2018.09.006. Epub 2018 Sep 18. Biosystems. 2018. PMID: 30240720 Review.
Cited by
-
Histone titration against the genome sets the DNA-to-cytoplasm threshold for the Xenopus midblastula transition.Proc Natl Acad Sci U S A. 2015 Mar 10;112(10):E1086-95. doi: 10.1073/pnas.1413990112. Epub 2015 Feb 23. Proc Natl Acad Sci U S A. 2015. PMID: 25713373 Free PMC article.
-
Regulation of organelle size and organization during development.Semin Cell Dev Biol. 2023 Jan 15;133:53-64. doi: 10.1016/j.semcdb.2022.02.002. Epub 2022 Feb 8. Semin Cell Dev Biol. 2023. PMID: 35148938 Free PMC article. Review.
-
IRBIT Directs Differentiation of Intestinal Stem Cell Progeny to Maintain Tissue Homeostasis.iScience. 2020 Mar 27;23(3):100954. doi: 10.1016/j.isci.2020.100954. Epub 2020 Feb 28. iScience. 2020. PMID: 32179478 Free PMC article.
-
Titration of four replication factors is essential for the Xenopus laevis midblastula transition.Science. 2013 Aug 23;341(6148):893-6. doi: 10.1126/science.1241530. Epub 2013 Aug 1. Science. 2013. PMID: 23907533 Free PMC article.
-
Comparative Metabolomics of Small Molecules Specifically Expressed in the Dorsal or Ventral Marginal Zones in Vertebrate Gastrula.Metabolites. 2022 Jun 20;12(6):566. doi: 10.3390/metabo12060566. Metabolites. 2022. PMID: 35736498 Free PMC article.
References
Publication types
MeSH terms
Substances
Grants and funding
LinkOut - more resources
Full Text Sources

