. 2011 Feb 8;5(2):e963.
doi: 10.1371/journal.pntd.0000963.

Filarial worms reduce Plasmodium infectivity in mosquitoes

Affiliations

Filarial worms reduce Plasmodium infectivity in mosquitoes

Matthew T Aliota et al. PLoS Negl Trop Dis. .

Abstract

Background: Co-occurrence of malaria and filarial worm parasites has been reported, but little is known about the interaction between filarial worm and malaria parasites with the same Anopheles vector. Herein, we present data evaluating the interaction between Wuchereria bancrofti and Anopheles punctulatus in Papua New Guinea (PNG). Our field studies in PNG demonstrated that An. punctulatus utilizes the melanization immune response as a natural mechanism of filarial worm resistance against invading W. bancrofti microfilariae. We then conducted laboratory studies utilizing the mosquitoes Armigeres subalbatus and Aedes aegypti and the parasites Brugia malayi, Brugia pahangi, Dirofilaria immitis, and Plasmodium gallinaceum to evaluate the hypothesis that immune activation and/or development by filarial worms negatively impact Plasmodium development in co-infected mosquitoes. Ar. subalbatus used in this study are natural vectors of P. gallinaceum and B. pahangi and they are naturally refractory to B. malayi (melanization-based refractoriness).

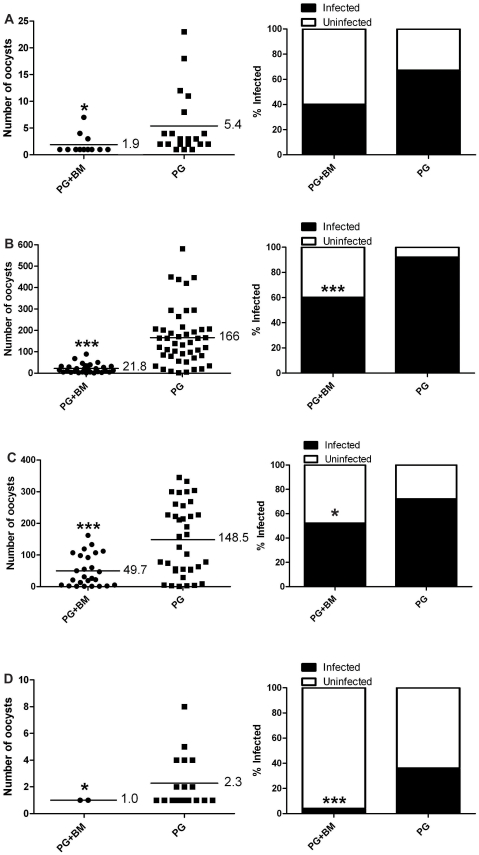
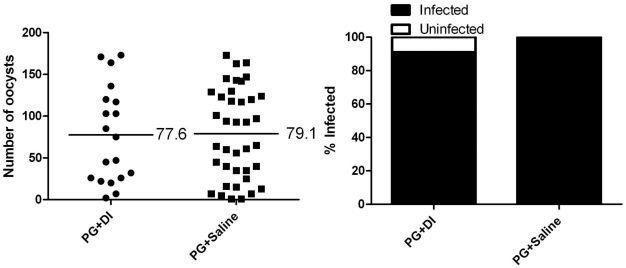
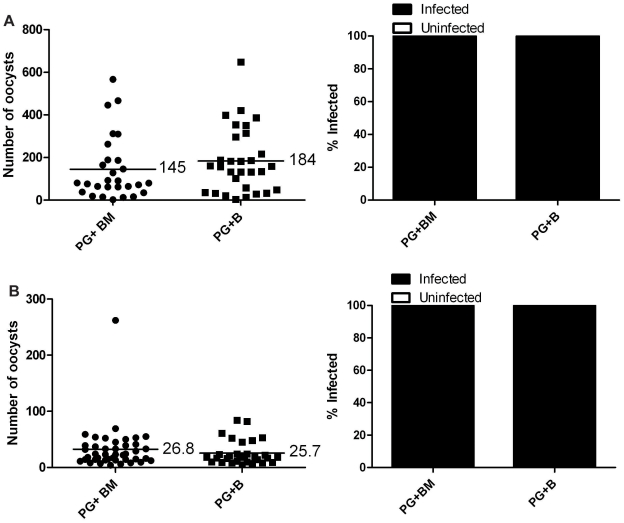
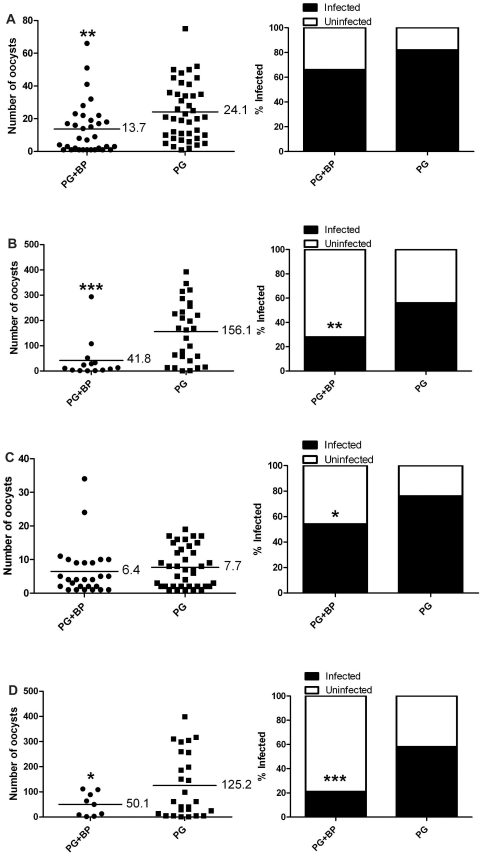
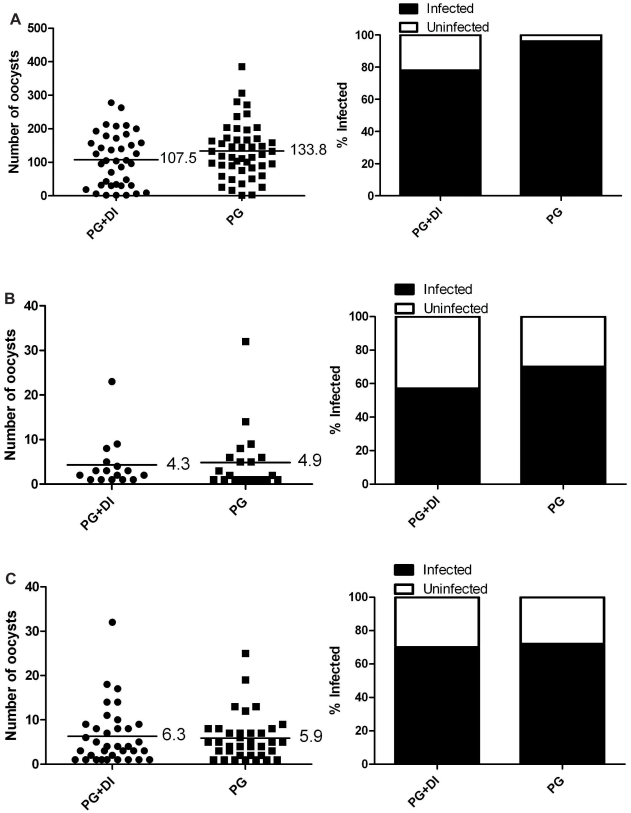
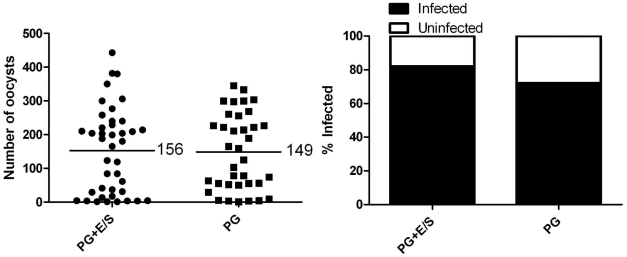
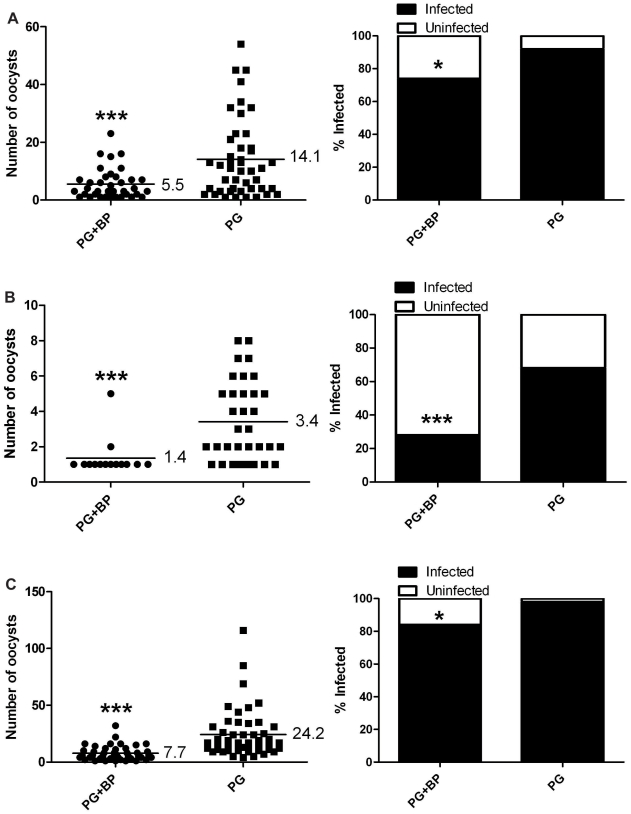
Methodology/principal findings: Mosquitoes were dissected and Plasmodium development was analyzed six days after blood feeding on either P. gallinaceum alone or after taking a bloodmeal containing both P. gallinaceum and B. malayi or a bloodmeal containing both P. gallinaceum and B. pahangi. There was a significant reduction in the prevalence and mean intensity of Plasmodium infections in two species of mosquito that had dual infections as compared to those mosquitoes that were infected with Plasmodium alone, and was independent of whether the mosquito had a melanization immune response to the filarial worm or not. However, there was no reduction in Plasmodium development when filarial worms were present in the bloodmeal (D. immitis) but midgut penetration was absent, suggesting that factors associated with penetration of the midgut by filarial worms likely are responsible for the observed reduction in malaria parasite infections.

Conclusions/significance: These results could have an impact on vector infection and transmission dynamics in areas where Anopheles transmit both parasites, i.e., the elimination of filarial worms in a co-endemic locale could enhance malaria transmission.


Conflict of interest statement

One of the authors, Dr. C.C. Chen, serves on the editorial board for PLoS NTDs.

Figures

Figure 1
Figure 1. Plasmodium infection in Ar. subalbatus that concurrently ingested P. gallinaceum and B. malayi.
Mosquitoes that fed on blood containing P. gallinaceum alone served as controls. For all, the left panel indicates infection intensity where points indicate the absolute value of oocyst counts in individual mosquitoes, and horizontal black bars represent the mean intensity. The right panel indicates prevalence of infection where the bars represent the total population of mosquitoes examined. The filled portion of the bars indicates the proportion of mosquito midguts that were positive for at least one oocyst; the unfilled portion of the bar indicates the proportion of midguts that were uninfected. PG, P. gallinaceum; BM, B. malayi; *, significant reduction in mean intensity and prevalence (*p<0.05, **p<0.01, ***p<0.001). A.) Biological replicate number 1, n = 30. B.) Biological replicate number 2, n = 50. C.) Biological replicate number 3, n = 50. D.) Biological replicate number 4, n = 50.
Figure 2
Figure 2. Plasmodium infection in mosquitoes inoculated with D. immitis mf immediately following blood feeding.
Mosquitoes that fed on blood containing P. gallinaceum and received a saline inoculation immediately following blood feeding served as controls. There was no significant difference in Plasmodium development between mosquitoes that were exposed to P. gallinaceum and intrathoracic injection of saline (n = 38) or mosquitoes exposed to P. gallinaceum and intrathoracic injection of D. immitis mf (n = 21). The left panel indicates infection intensity where points indicate the absolute value of oocyst counts in individual mosquitoes, and horizontal black bars represent the mean intensity. The right panel indicates prevalence of infection where the bars represent the total population of mosquitoes examined. The filled portion of the bars indicates the proportion of mosquito midguts that were positive for at least one oocyst; the unfilled portion of the bar indicates the proportion of midguts that were uninfected. PG, P. gallinaceum; DI, D. immitis.
Figure 3
Figure 3. A secondary exposure to B. malayi does not affect Plasmodium development.
Mosquitoes that had a primary exposure to P. gallinaceum and a secondary exposure to uninfected blood served as controls. Mosquitoes that had a primary exposure to P. gallinaceum and a secondary exposure to B. malayi served as the experimental group. For both, the left panel indicates infection intensity where points indicate the absolute value of oocyst counts in individual mosquitoes, and horizontal black bars represent the mean intensity. The right panel indicates prevalence of infection where the bars represent the total population of mosquitoes examined. The filled portion of the bars indicates the proportion of mosquito midguts that were positive for at least one oocyst; the unfilled portion of the bar indicates the proportion of midguts that were uninfected. There was no significant difference in Plasmodium development between mosquitoes that received a primary exposure to P. gallinaceum followed by a secondary exposure to uninfected blood or mosquitoes that received a primary exposure to P. gallinaceum followed by a secondary exposure to B. malayi-infected blood. PG, P. gallinaceum; BM, B. malayi; B, uninfected blood. A.) Biological replicate number 1, PG+BM n = 28, PG+B n = 30. B.) Biological replicate number 2, PG+BM n = 42, PB+B n = 30.
Figure 4
Figure 4. Plasmodium infection in Ar. subalbatus that concurrently ingested P. gallinaceum and B. pahangi.
Mosquitoes that fed on blood containing P. gallinaceum alone served as controls. For all, the left panel indicates infection intensity where points indicate the absolute value of oocyst counts in individual mosquitoes, and horizontal black bars represent the mean intensity. The right panel indicates prevalence of infection where the bars represent the total population of mosquitoes examined. The filled portion of the bars indicates the proportion of mosquito midguts that were positive for at least one oocyst; the unfilled portion of the bar indicates the proportion of midguts that were uninfected. PG, P. gallinaceum; BP, B. pahangi; *, significant reduction in mean intensity and prevalence (*p<0.05, **p<0.01, ***p<0.001). A.) Biological replicate number 1, n = 50. B.) Biological replicate number 2, n = 50. C.) Biological replicate number 3, n = 50. D.) Biological replicate number 4, PG+BP n = 43, PG+B n = 45.
Figure 5
Figure 5. Plasmodium infection in Ar. subalbatus that concurrently ingested P. gallinaceum and D. immitis.
Mosquitoes that fed on blood containing P. gallinaceum alone served as controls. For all, the left panel indicates infection intensity where points indicate the absolute value of oocyst counts in individual mosquitoes, and horizontal black bars represent the mean intensity. The right panel indicates prevalence of infection where the bars represent the total population of mosquitoes examined. The filled portion of the bars indicates the proportion of mosquito midguts that were positive for at least one oocyst; the unfilled portion of the bar indicates the proportion of midguts that were uninfected. There was no significant difference between mosquitoes that were exposed to P. gallinaceum alone or mosquitoes exposed to a bloodmeal that contained both P. gallinaceum and D. immitis. PG, P. gallinaceum; DI, D. immitis. A.) Biological replicate number 1, PG+DI n = 50, PG+B n = 49. B.) Biological replicate number 2, PG+DI n = 28, PG+B n = 30. C.) Biological replicate number 3, n = 50.
Figure 6
Figure 6. B. malayi E/S products have no effect on Plasmodium infection.
Plasmodium infection intensity and prevalence in Ar. subalbatus exposed to P. gallinaceum-infected blood supplemented with B. malayi E/S products. Mosquitoes that fed on blood containing P. gallinaceum alone served as controls. Points indicate the absolute value of oocyst counts in individual mosquitoes, and horizontal black bars represent the mean intensity. There was no significant difference in Plasmodium development between mosquitoes that were exposed to P. gallinaceum alone (n = 50) or mosquitoes exposed to a bloodmeal that contained P. gallinaceum supplemented with B. malayi E/S products (n = 50). The left panel indicates infection intensity where points indicate the absolute value of oocyst counts in individual mosquitoes, and horizontal black bars represent the mean intensity. The right panel indicates prevalence of infection where the bars represent the total population of mosquitoes examined. The filled portion of the bars indicates the proportion of mosquito midguts that were positive for at least one oocyst; the unfilled portion of the bar indicates the proportion of midguts that were uninfected. PG, P. gallinaceum; E/S, B. malayi excretory/secretory products.
Figure 7
Figure 7. Plasmodium infection in Ae. aegypti that concurrently ingested P. gallinaceum and B. pahangi.
Mosquitoes that fed on blood containing P. gallinaceum alone served as controls. For all, the left panel indicates infection intensity where points indicate the absolute value of oocyst counts in individual mosquitoes, and horizontal black bars represent the mean intensity. The right panel indicates prevalence of infection where the bars represent the total population of mosquitoes examined. The filled portion of the bars indicates the proportion of mosquito midguts that were positive for at least one oocyst; the unfilled portion of the bar indicates the proportion of midguts that were uninfected. PG, P. gallinaceum; BP, B. pahangi; *, significant reduction in mean intensity and prevalence (*p<0.05, **p<0.01, ***p<0.001). A.) Biological replicate number 1, n = 50. B.) Biological replicate number 2, n = 50. C.) Biological replicate number 3, n = 50.

Similar articles

Cited by

References

    1. Breman JG. The ears of the hippopotamus: manifestations, determinants, and estimates of the malaria burden. Am J Trop Med Hyg. 2001;64:1–11. - PubMed
    1. Molyneux DH. Control of human parasitic diseases: Context and overview. Adv Parasitol. 2006;61:1–45. - PubMed
    1. Muturi EJ, Jacob BG, Kim CH, Mbogo CM, Novak RJ. Are coinfections of malaria and filariasis of any epidemiological significance? Parasitol Res. 2008;102:175–181. - PubMed
    1. Mathers CD, Ezzati M, Lopez AD. Measuring the burden of neglected tropical diseases: the global burden of disease framework. PLoS Negl Trop Dis. 2007;1:e114. - PMC - PubMed
    1. Burkot TR, Molineaux L, Graves PM, Paru R, Battistutta D, et al. The prevalence of naturally acquired multiple infections of Wuchereria bancrofti and human malarias in anophelines. Parasitology 100 Pt. 1990;3:369–375. - PubMed

Publication types