. 2011 Mar;31(3):217-24.
doi: 10.1007/s10059-011-0036-4. Epub 2011 Jan 21.

Characterization of the structure and DNA complexity of mung bean mitochondrial nucleoids

Affiliations

Characterization of the structure and DNA complexity of mung bean mitochondrial nucleoids

Yih-Shan Lo et al. Mol Cells. 2011 Mar.

Abstract

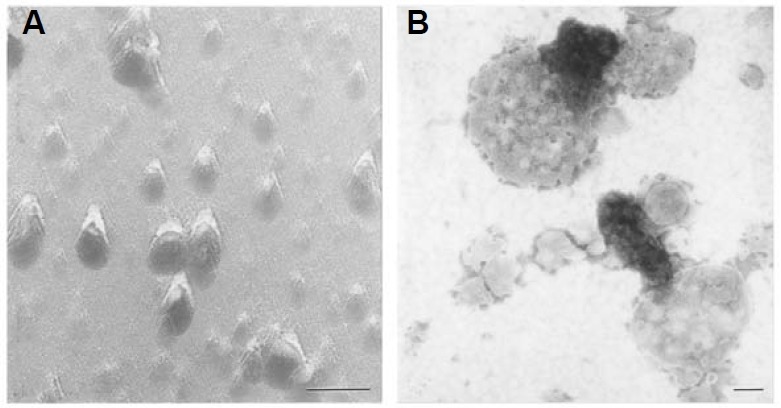
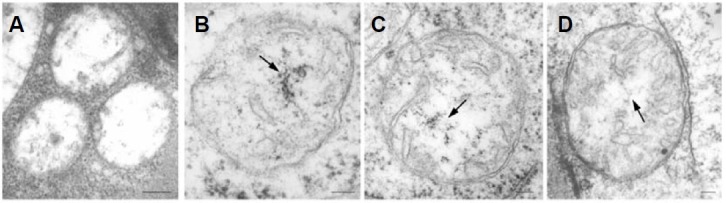
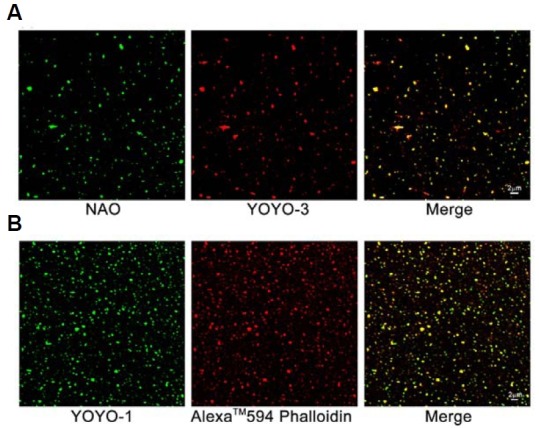
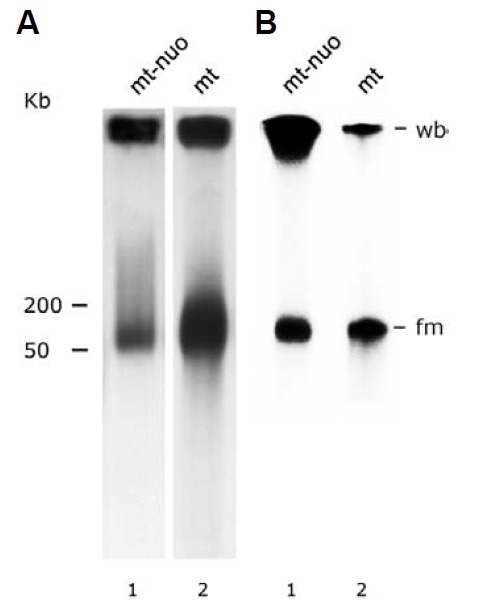
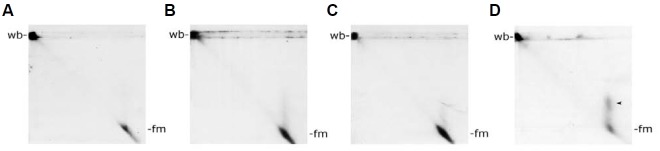
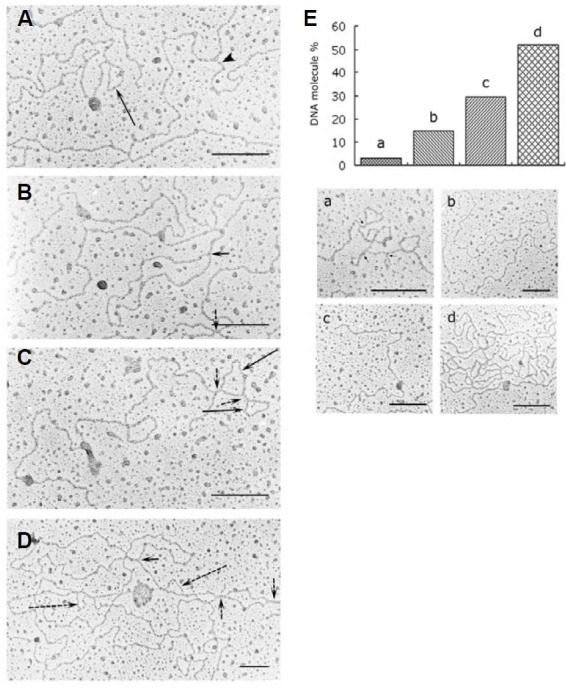
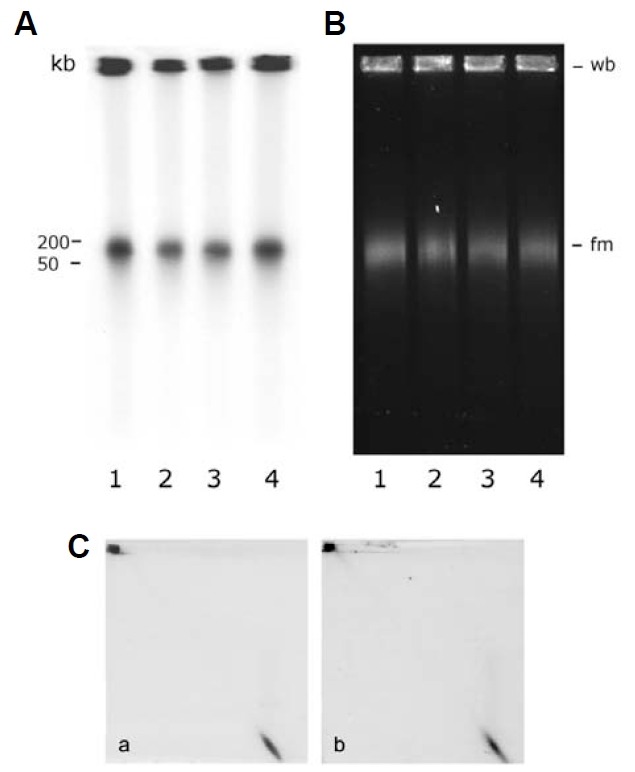
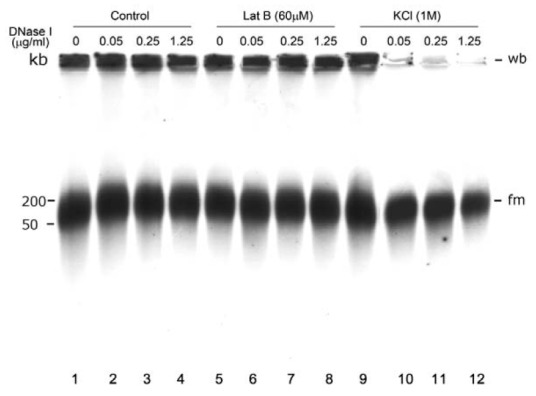
Electron microscopic images of mitochondrial nucleoids isolated from mung bean seedlings revealed a relatively homogeneous population of particles, each consisting of a chromatin-like structure associated with a membrane component. Association of F-actin with mitochondrial nucleoids was also observed. The mitochondrial nucleoid structure identified in situ showed heterogeneous genomic organization. After pulsed-field gel electrophoresis (PFGE), a large proportion of the mitochondrial nucleoid DNA remained in the well, whereas the rest migrated as a 50-200 kb smear zone. This PFGE migration pattern was not affected by high salt, topoisomerase I or latrunculin B treatments; however, the mobility of a fraction of the fast-moving DNA decreased conspicuously following an in-gel ethidium-enhanced UV-irradiation treatment, suggesting that molecules with intricately compact structures were present in the 50-200 kb region. Approximately 70% of the mitochondrial nucleoid DNA molecules examined via electron microscopy were open circles, supercoils, complex forms, and linear molecules with interspersed sigma-shaped structures and/or loops. Increased sensitivity of mtDNA to DNase I was found after mitochondrial nucleoids were pretreated with high salt. This result indicates that some loosely bound or peripheral DNA binding proteins protected the mtDNA from DNase I degradation.


Figures

Fig. 1.
Fig. 1.. Visualization of mitochondrial nucleoids by electron microscopy. Freshly isolated mitochondrial nucleoid samples from a highly purified orthodox mitochondrial population (Dai et al., 1998) were freeze fractured (A), or negatively stained with 1% sodium phospho-tungstate at pH 7.0 (B) for electron microscopy. Bars: 100 nm.
Fig. 2.
Fig. 2.. Chromatin-like DNA structures in mitochondria from different plant tissues. Cotyledons of mung bean seeds immersed in 4℃ water for 12 h (A), 27℃ water for 12 h (B), or 27℃ water for 12 h followed by 12 h of growth on vermiculite (C), and the hook region of 3-day-old etiolated mung bean seedlings were fixed, embedded, sectioned and stained for electron microscopy as described. No visible chromatin- or fibril-like structures is observed in 12 h-4℃ immersed cotyledon mitochondria (A). Chromatin-like structures are observed in 12 h-27℃ cotyledon mitochondria (B, see arrow). Fibril-like mitochondrial nucleoids instead of chromatin-like structure are visualized when cotyledons reached day 1 of seed germination (C, see arrow). In situ mitochondrial nucleoids from a hook region of a day 3 mung bean seedling exhibiting a fibril-like mtDNA organization phase similar to that of the day-1 cotyledon mitochondrial nucleoids is shown in Fig. 2D. Bars:100 nm.
Fig. 3.
Fig. 3.. Mitochondrial nucleoids associated with the inner mitochondrial membrane and F-actin were detected by fluorescent image analysis. Mitochondrial nucleoid samples were double stained with the DNA-specific dye YOYO-3 and the cardiolipin-specific dye NAO (A) or were double stained with the DNA-specific dye YOYO-1 and the F-actin-specific dye Alexa TM 594 Phalloidin (B) followed by confocal microscopic analysis. The merged yellow fluorescence shown in (A, B) indicates that mitochondrial nucleoids are composed of both mtDNA and mitochondrial membrane (A), and an association of F-actin with mtDNA is also evidenced (B).
Fig. 4.
Fig. 4.. Fractionation of mitochondrial nucleoid DNA by PFGE. (A) Southern hybridization analysis of DNA from mitochondrial nucleoids (mt-nuo, lane 1) and from mitochondria (mt, lane 2) after size fractionation by pulsed field gel electrophoresis. The amounts of mitochondria and mitochondrial nucleoids used for PFGE were 200 μg and 20 μg, respectively. The probe used was pure mtDNA. The well-bound fraction (wb) remained at the top of the gel. The molecular weight (kb) of the DNA is indicated at the left side of the figure. (B) Autoradiogram of newly-synthesized mitochondrial nucleoid DNA (mt-nuo, lane 1) and mitochondrial DNA (mt, lane 2) fraction-ated by PFGE. The X-ray film was exposed for a very short period (~5 h).
Fig. 5.
Fig. 5.. Two-dimensional pulsed field gel electrophoretic analysis of the mobility of mitochondrial nucleoid fm-DNA with and without EtBr/UV treatment. Mitochondrial nucleoid DNA was fractionated by first-dimension PFGE followed by in-gel EtBr/UV treatment as described in “Materials and Methods”. Second-dimension PFGE was then carried out with the same program as the first-dimension PFGE. Mitochondrial nucleoid DNA in the gel was then detected by Southern blot analysis as described above. No EtBr/UV treatment, only EtBr treatment, only UV treatment, and EtBr/UV treatment are shown in (A, B, C and D), respectively. After second- dimension PFGE analysis, a minor fraction of the fm population appears as a faint streak with varying degrees of migration retardation upon EtBr and UV treatment, respectively (Figs. 5B and 5C). Combined EtBr-UV treatment synergistically retarded a sizable fraction of the fm population (Fig. 5D).
Fig. 6.
Fig. 6.. Electron micrographs of mitochondrial nucleoid DNA. (A-D) present four examples of different conformational structures of mitochondrial nucleoid DNA. The long arrow in (A) indicates a small circular mtDNA structure. The arrowhead in (A) shows a branch from a linear mtDNA molecule. Sigma-like structures are exhibited in (B, D) as indicated by short arrows. The dotted short arrows in (B, C, and D) indicate possible “four-stranded joint regions.” The long arrows in (C) indicate two continuous small circles of mtDNA. The dotted long arrows in (D) indicate D-loop bubble structures. More than 50% of the mitochondrial nucleoid DNA molecules we examined showed highly complex structures, as exhibited in the histogram of Fig. 6E (d). The distributions of supercoiled DNA (a), open circular DNA (b), and linear form DNA (c) among the mitochondrial nucleoid population we examined are presented in histogram of (E). EM pictures of supercoiled DNA, open circular DNA, linear DNA and complex DNA forms are presented as a, b, c and d, respectively, at the bottom section of (E). The total number of DNA molecules we examined was 121. Bars: 200 nm in (A) through (E).
Fig. 7.
Fig. 7.. The effect of topoisomerase I treatment on mitochondrial nucleoid DNA. (A) In vitro mitochondrial nucleoid DNA synthesis was carried out for 1 h as described in “Materials and Methods”. The newly-synthesized mitochondrial nucleoid DNA was then treated with different concentration of topoisomerase I. Lanes 1, 2, 3 and 4 show the newly synthesized mitochondrial nucleoid DNA PFGE migration pattern after treatment with 0, 0.4, 2 and 20 units of topoisomerase I, respectively. (B) presents the PFGE fractionation pattern of mitochondrial nucleoid DNA after topoisomerase I treatment. Mitochondrial nucleoids not processed for DNA synthesis were treated with 0, 1, 5 and 20 units of topoisomerase I and are presented in lanes 1, 2, 3 and 4, respectively. No migration alteration of well-bound (wb) or fast-moving (fm) DNA caused by topoisomerase I treatment was detected in a second dimensional PFGE analysis [(C), treatment with 0 and 20 units topoisomerase I/reaction is shown in a and b, respectively].
Fig. 8.
Fig. 8.. Effects of high salt and latrunculin B treatments on the sensitivity of mitochondrial nucleoid DNA to DNase I degradation. Purified mitochondrial nucleoids were treated with 1 M KCl or 60 μM latrunculin B (Lat B) followed by different concentration of DNase I. No change in the mtDNA PFGE migration pattern was detected in response to high salt or latrunculin B treatment of mitochondrial nucleoid DNA (compare lanes 1, 5, and 9). However, the sensitivity of mtDNA to DNase I significantly increased after mitochondrial nucleoids were stripped by KCl. The same effect was not found with latrunculin B-treated mitochondrial nucleoids. DNase I was applied at 0 μg/ml (lanes 1, 5, and 9), 0.05 μg/ml (lanes 2, 6, and 10), 0.25 μg/ml (lanes 3, 7, and 11) and 1.25 μg/ml (lanes 4, 8, and 12).

Similar articles

Cited by

References

    1. Andre C.P., Walbot V. Pulsed-field gel mapping of maize mitochondrial chromosomes. Mol. Gen. Genet. (1995);247:255–263. - PubMed
    1. Backert S., Börner T. Phage T-4-like intermediates of DNA replication and recombination in the mitochondria of the higher plant Chenopodium album (L.). Curr. Genet. (2000);37:304–314. - PubMed
    1. Backert S., Lurz R., Börner T. Electron micro-scopic investigation of mitochondrial DNA from Chenopodium album (L.). Curr. Genet. (1996);29:427–436. - PubMed
    1. Backert S., Lurz R., Oyarzabal O.A., Borner T. High content, size and distribution of single-stranded DNA in the mitochondria of Chenopodium album (L.). Plant Mol. Biol. (1997);33:1037–1050. - PubMed
    1. Bendich A.J. Structural analysis of mitochondrial DNA molecules from fungi and plants using moving pictures and pulsed-field gel electrophoresis. J. Mol. Biol. (1996);255:564–588. - PubMed

Publication types

MeSH terms

LinkOut - more resources