. 2011 Feb;31(2):123-32.
doi: 10.1007/s10059-011-0016-8. Epub 2011 Jan 18.

Biochemical and morphological effects of hypoxic environment on human embryonic stem cells in long-term culture and differentiating embryoid bodies

Affiliations

Biochemical and morphological effects of hypoxic environment on human embryonic stem cells in long-term culture and differentiating embryoid bodies

Hee-Joung Lim et al. Mol Cells. 2011 Feb.

Abstract

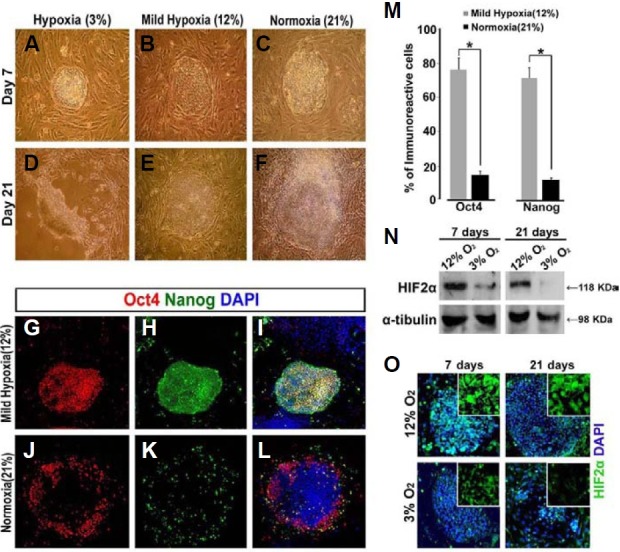
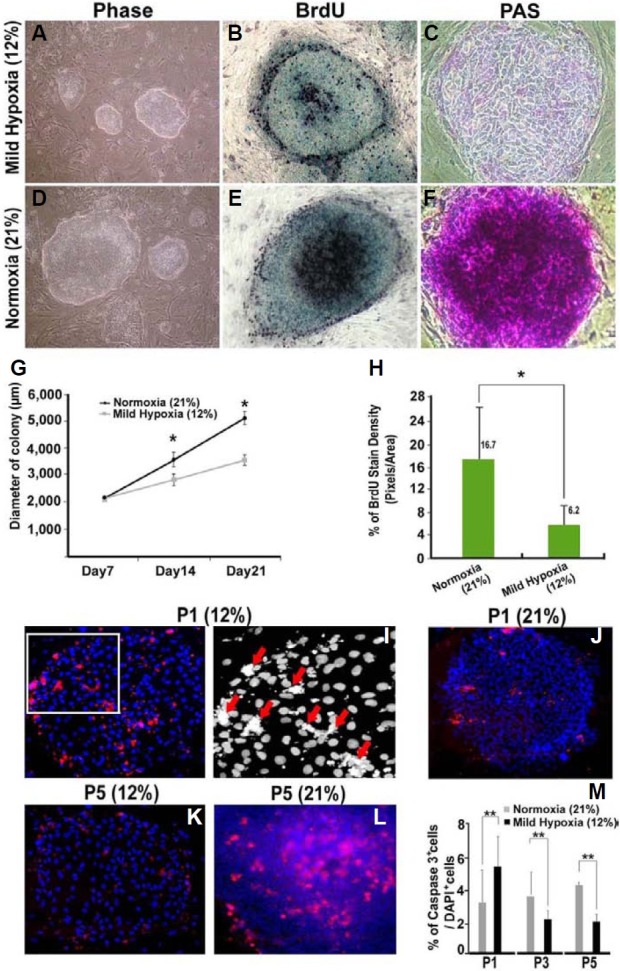
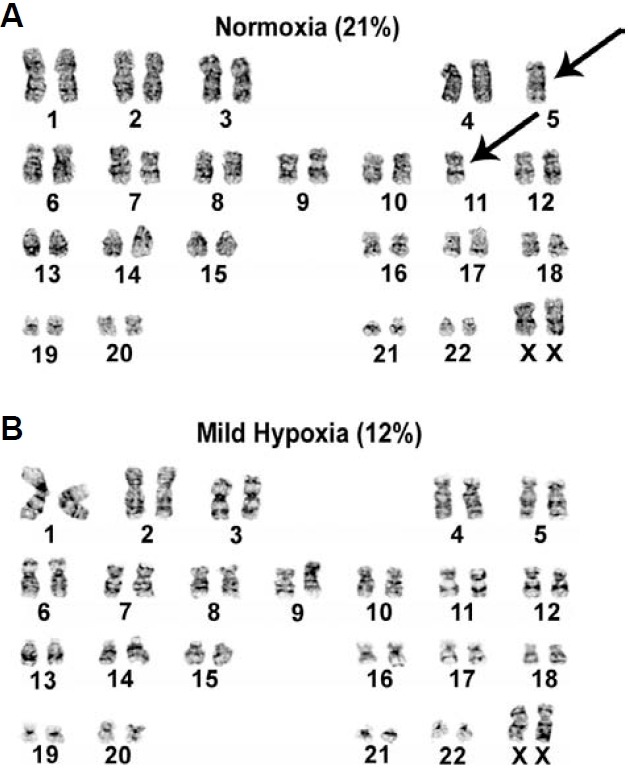
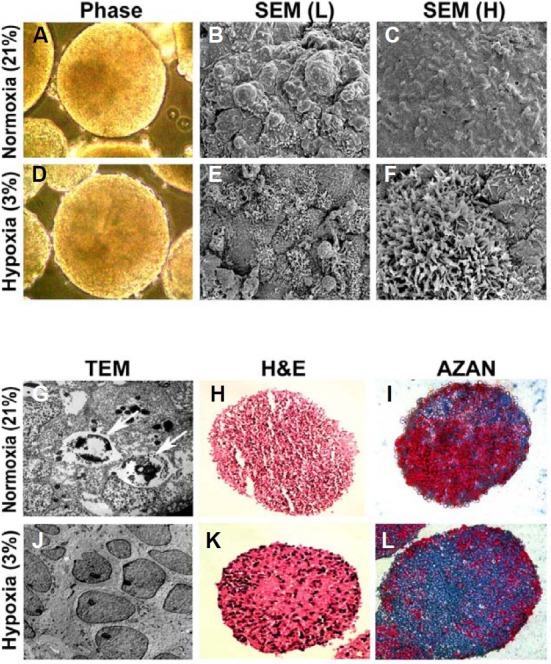
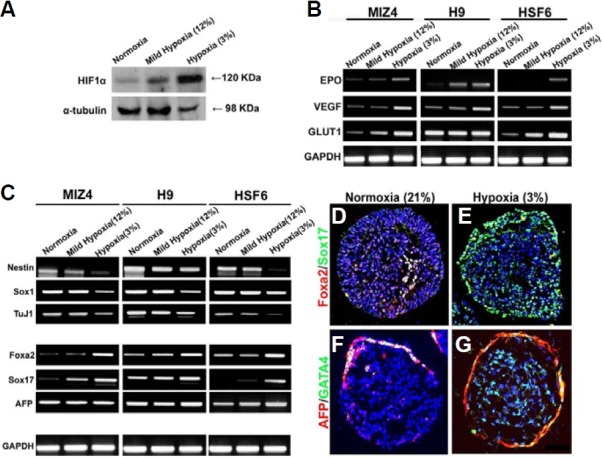
The mammalian reproductive tract is known to contain 1.5-5.3% oxygen (O(2)), but human embryonic stem cells (hESCs) derived from preimplantation embryos are typically cultured under 21% O(2) tension. The aim of this study was to investigate the effects of O(2) tension on the long-term culture of hESCs and on cell-fate determination during early differentiation. hESCs and embryoid bodies (EBs) were grown under different O(2) tensions (3, 12, and 21% O(2)). The expression of markers associated with pluripotency, embryonic germ layers, and hypoxia was analyzed using RTPCR, immunostaining, and Western blotting. Proliferation, apoptosis, and chromosomal aberrations were examined using BrdU incorporation, caspase-3 immunostaining, and karyotype analysis, respectively. Structural and morphological changes of EBs under different O(2) tensions were comparatively examined using azan- and hematoxylineosin staining, and scanning and transmission electron microscopy. Mild hypoxia (12% O(2)) increased the number of cells expressing Oct4/Nanog and reduced BrdU incorporation and aneuploidy. The percentage of cells positive for active caspase-3, which was high during normoxia (21% O(2)), gradually decreased when hESCs were continuously cultured under mild hypoxia. EBs subjected to hypoxia (3% O(2)) exhibited well-differentiated microvilli on their surface, secreted high levels of collagen, and showed enhanced differentiation into primitive endoderm. These changes were associated with increased expression of Foxa2, Sox17, AFP, and GATA4 on the EB periphery. Our data suggest that mild hypoxia facilitates the slow mitotic division of hESCs in long-term culture and reduces the frequency of chromosomal abnormalities and apoptosis. In addition, hypoxia promotes the differentiation of EBs into extraembryonic endoderm.


Figures

Fig. 1.
Fig. 1.. Effect of O2 tension on maintenance of the undifferentiated state of hESCs. hESCs (passage 44) were cultured on MEF feeder cells under different O2 tensions. (A-F) Phase contrast images of hESC colonies cultured under different O2 tensions. (G-L) Immunostaining to detect expression of the undifferentiated markers Oct4 (red) and Nanog (green). DAPI (blue) was used as a nuclear counterstain. (M) Quantitative analysis of Oct4 and Nanog expression in colonies. Randomly selected fields (n = 5) from a minimum of three independent experiments were analyzed. *P < 0.05. Results for each O2 condition were present as a percentage of the expression of undifferentiated-cell markers in colonies containing 1,000-2,000 DAPI-positive cells. (N) Expression of HIF2α in undifferentiated hESCs was analyzed by Western blotting. (O) Immunostaining to detect the expression of HIF2α (green) and DAPI (blue) in hESC colonies. Magnification, 100×.
Fig. 2.
Fig. 2.. Effects of O2 tension on the proliferation and apoptosis of hESCs. hESCs from passages 44 (P1) to 48 (P5) were cultured on MEF feeder cells for 21 days. (A, D) Phase contrast images of hESC colonies grown under two different O2 tensions. (B, E) BrdU (black) incorporation assays showing reduced proliferation of hESCs under mild hypoxia, as compared to normoxia. Methylene green was used as a nuclear counterstain. (C, F) PAS staining (purple) of hESC colonies. Note a higher glycogen accumulation in cells under normoxia, as compared to mild hypoxia. (G) Size of hESC colonies under two different O2 tensions on days 7, 14, and 21 of culture. Diameters of colonies (approximately 2,000-6,000 μm) were presented as mean ± SEM. *P < 0.05. (H) The percentages of BrdU-positive pixels/total area in five randomly selected fields analyzed using Scion software. *P < 0.05. (I-L) Detection of apoptotic cells under indicated O2 tensions at P1, P3 and P5 using an antibody against active Caspase-3. The boxed area of the left panel in I is shown in the right panel as a black-and-white image at high magnification. Red arrows indicate nuclear fragmentation. (M) The apoptotic rates under different O2 ten-sions are shown as the average percentage of active Caspase-3-positive cells ± SEM over DAPI-positive cells in randomly selected fields (n = 5) from a minimum of three independent experiments. *P < 0.05; **P < 0.01. Magnification: 100× in A, B, C, E, F, G, I (left panel), J, K and L; 200× in I (right panel).
Fig. 3.
Fig. 3.. Effect of O2 tension on genetic stability during hESC proliferation. (A, B) Representative karyotypes of hESCs grown under normoxia at passage 63 (A) and hESCs grown under hypoxia (B) A total of 20 consecutive metaphase spreads (passages 44 to 64) were analyzed to identify chromosomal abnormalities (both numerical and structural). Arrows denote chromosome 5 and 11 abnormalities.
Fig. 4.
Fig. 4.. Effects of O2 tension on the morphology and histology of differentiating EBs. (A, D) Phase contrast images of the EB surface under two different O2 tensions. (B, C, E, and F) Ultrastructural images of EB surfaces obtained by scanning electron microscopy (L, low magnification; H, high magnification). Note a large number of well-developed microvilli on the surface of EBs grown under hypoxia (E, F). (G, J) Representative TEM images of a EB showing apoptotic bodies containing condensed nuclear material under normoxia (white arrows in G), and normal nuclei with prominent nucleoli and no condensed chromatin under hypoxia. (H, K) Hematoxylin and eosin staining of EB sections (black: nuclei, red: cytoplasm). (I, L) Azan and Masson’s trichrome staining of EB sections for detection of collagen accumulation (blue) in EBs grown under normoxia or hypoxia. Magnification: 100× in (A), (D), (H), (I), (K) and (L); 700× in (B) and (E); 2,000× in (C) and (F); 10,000× in (G) and (J).
Fig. 5.
Fig. 5.. Effects of O2 tension on the differentiation of early cell types during EB formation. (A) Expression of HIF1α at 8 days of EB formation was analyzed by Western blotting. (B) Expression of hypoxia markers (EPO, VEGF, and Glut1) in EBs were examined by RT-PCR. (C) RT-PCR analysis for markers of embryonic cell lineages in EBs grown under three different O2 conditions. (D-G) Representative immunofluorescence images of frozen EB sections stained for endoderm markers. Note the prominent localization of immunoreactive cells at the periphery of EBs grown under hypoxia, as compared to those grown under normoxia. Magnification, 100×.

References

    1. Abeyta M.J., Clark A.T., Rodriguez R.T., Bodnar M.S., Pera R.A., Firpo M.T. Unique gene expression signatures of independently-derived human embryonic stem cell lines. Hum. Mol. Genet. (2004);13:601–608. - PubMed
    1. Amit M., Margulets V., Segev H., Shariki K., Laevsky I., Coleman R., Itskovitz-Eldor J. Human feeder layers for human embryonic stem cells. Biol. Reprod. (2003);68:2150–2156. - PubMed
    1. Aplin J.D. Hypoxia and human placental development. J. Clin. Invest. (2000);105:559–560. - PMC - PubMed
    1. Barberini F., Makabe S., Franchitto G., Correr S., Relucenti M., Heyn R., Familiari G. Ultrastructural dynamics of the human endometrium from 14 to 22 weeks of gestation. Arch. Histol. Cytol. (2007);70:21–28. - PubMed
    1. Bassett C.A., Herrmann I. Influence of oxygen concentration and mechanical factors on differentiation of connective tissues in vitro. Nature. (1961);190:460–461. - PubMed

Publication types

MeSH terms