Review
. 2011 May;12(5):e504-15.
doi: 10.1111/j.1467-789X.2010.00824.x. Epub 2011 Feb 23.

Assessment of abdominal adipose tissue and organ fat content by magnetic resonance imaging

Affiliations
Review

Assessment of abdominal adipose tissue and organ fat content by magnetic resonance imaging

H H Hu et al. Obes Rev. 2011 May.

Abstract

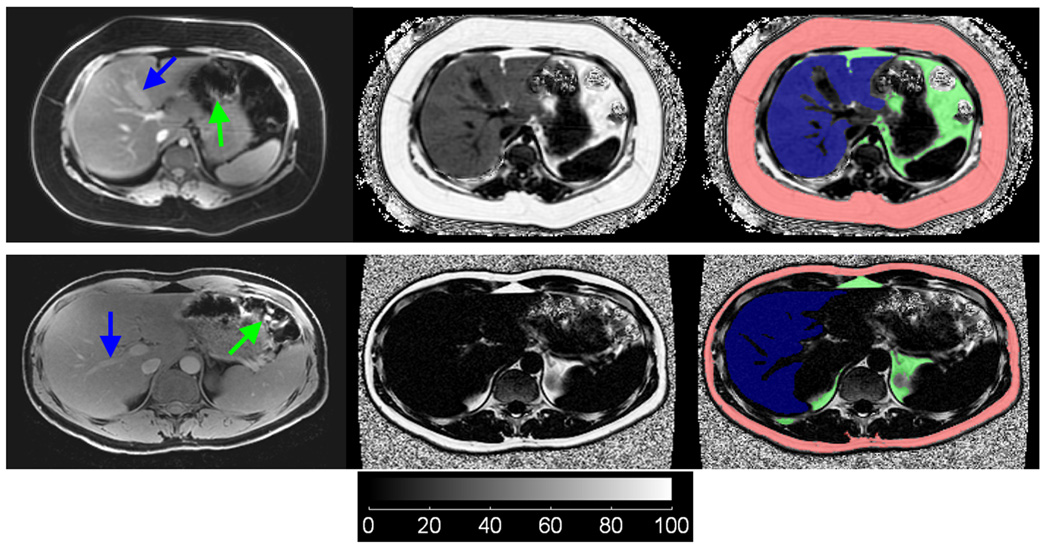
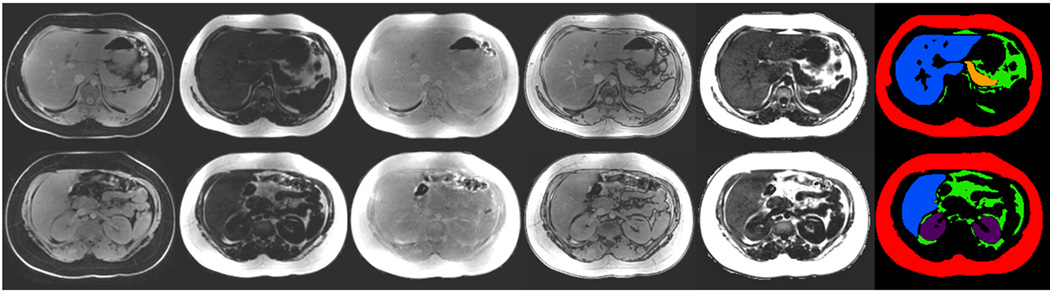
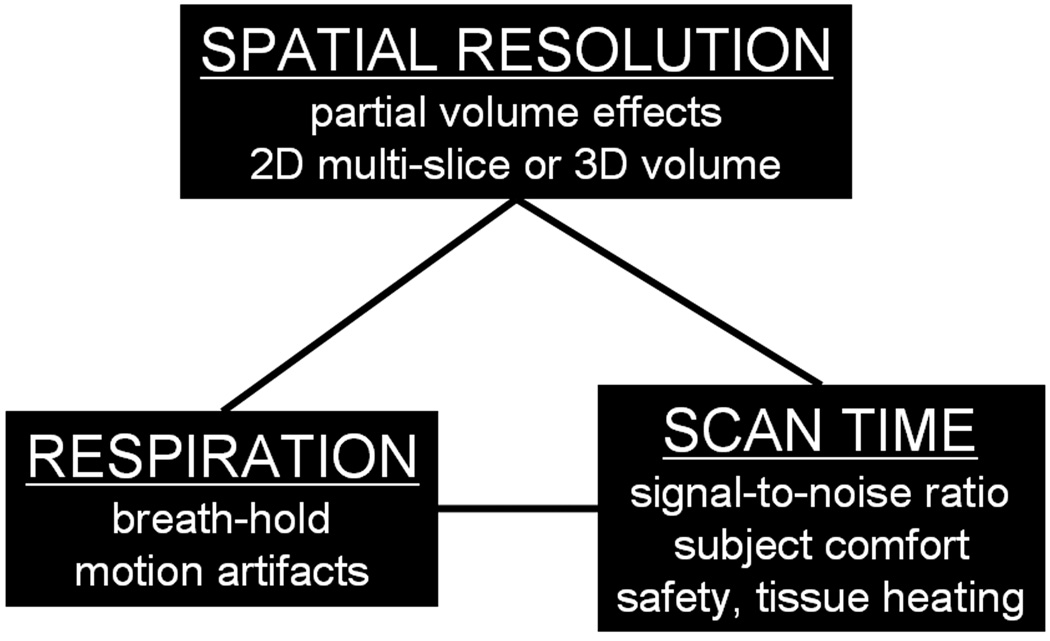
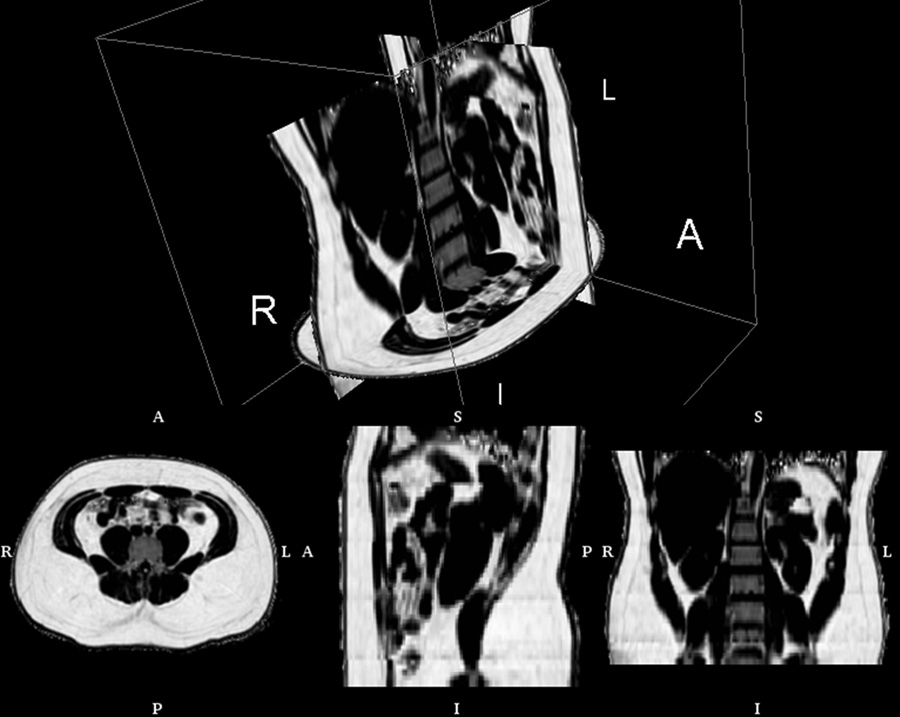
As the prevalence of obesity continues to rise, rapid and accurate tools for assessing abdominal body and organ fat quantity and distribution are critically needed to assist researchers investigating therapeutic and preventive measures against obesity and its comorbidities. Magnetic resonance imaging (MRI) is the most promising modality to address such need. It is non-invasive, utilizes no ionizing radiation, provides unmatched 3-D visualization, is repeatable, and is applicable to subject cohorts of all ages. This article is aimed to provide the reader with an overview of current and state-of-the-art techniques in MRI and associated image analysis methods for fat quantification. The principles underlying traditional approaches such as T(1) -weighted imaging and magnetic resonance spectroscopy as well as more modern chemical-shift imaging techniques are discussed and compared. The benefits of contiguous 3-D acquisitions over 2-D multislice approaches are highlighted. Typical post-processing procedures for extracting adipose tissue depot volumes and percent organ fat content from abdominal MRI data sets are explained. Furthermore, the advantages and disadvantages of each MRI approach with respect to imaging parameters, spatial resolution, subject motion, scan time and appropriate fat quantitative endpoints are also provided. Practical considerations in implementing these methods are also presented.


Conflict of interest statement

Conflicts of Interests

None – all authors

Figures

Figure 1
Figure 1
Examples of T1-weighted axial MR images acquired in the (a) abdomen and (b) thigh, demonstrating the typical high signal intensities of fatty tissues (arrows) in contrast to other darker muscles and organs (L: liver, P: pancreas, K: kidneys, M: muscle). Data were acquired on a GE 1.5 Tesla scanner (Signa HD, 12M5).
Figure 2
Figure 2
Example of two-point CSI technique. In-phase (IP) and out-of-phase (OP) images from two subjects are shown. In the OP images, a dark line is present at all fat and lean tissue interfaces. This is caused by signal cancellation between fat and water species within the voxels. All IP and OP images are displayed on the same grayscale. In (a), signal intensities within the liver between the two images are similar, indicating very little presence of hepatic fat. However in (b), the liver signal intensity is markedly lower in the OP image (dashed region), indicative of fat presence. This is visualized in the zoomed difference images. The liver in (a) exhibits residual signal whereas that in (b) shows appreciable signal. As corroborated by MRS, the hepatic fat fractions were 3.4% and 21.2%, respectively
Figure 3
Figure 3
Examples of 3 Tesla IDEAL. Reconstructed water-only, fat-only, and fat fraction images are illustrated for the thigh and upper abdomen. In the color fat fractions, the scale represents 0–100% percent fat content. In the thighs, note that subcutaneous and intramuscular adipose tissues and bone marrow are denoted by high (> 90% red) fat fractions. In the liver example, the color representation is indicative of very high 40% hepatic fat content. Coronal reformat illustrates the entire liver. The arrow in the water image denotes ripple-like artifacts from respiratory motion.
Figure 4
Figure 4
Examples of SliceOmatic segmentation to delineate the subcutaneous (red) and visceral (green) adipose tissue depots. Note the evident difference in visceral adipose tissue quantity between the two subjects. T1-weighted in-phase (left column) and out-of-phase (middle column) images are shown. Labels (right column) were generated from in-phase images for volume accuracy, using the out-of-phase image for fat-muscle boundary guidance. Arrows highlight bright intensity regions caused by close proximity of the anatomy to receiver arrays. Note that bowels, intramuscular fat, blood vessels, bone, and spine-vertebrae structures are excluded from visceral fat segmentation.
Figure 5
Figure 5
IDEAL image segmentation from two subjects, one with a fatty liver (top row) and one with a non-fatty liver (bottom row). Water-only, fat fraction, and overlay of segmentation labels (Red: subcutaneous adipose tissue, Green: visceral adipose tissue, Blue: liver) are shown in the left, middle, and right columns, respectively. For illustration purpose, the fuzzy noisy background in the fat fraction images has not been removed. In the fatty liver subject, note that hepatic vessels and the gall bladder (blue arrows) are well delineated in both water and fat fraction images, whereas in the non-fatty liver subject, such structures are only observed in the water image. Note that corresponding segmentation labels of the liver exclude these non-liver-tissue structures. Similarly, VAT labels do not include erroneous signals from empty bowels (green arrows).
Figure 6
Figure 6
Manual image segmentation using SliceOmatic and the full spectrum of IDEAL data to further delineate abdominal organs (Red: subcutaneous adipose tissue, Green: visceral adipose tissue, Blue: liver, Yellow: pancreas, Purple: kidneys). Left to right: water-only, fat-only, in-phase, out-of-phase, fat fraction, and segmented labels. Labels were generated from the first four columns of source gray-scale images.
Figure 7
Figure 7
Practical imaging parameters and considerations in MRI. In designing an appropriate protocol, one must consider the desired quantitative endpoints and leverage spatial resolution, scan time, patient safety, and the need for breath-holding.
Figure 8
Figure 8
Abdominal fat fraction volume from IDEAL, illustrating the contiguous 3D nature of the data. The volume consists of more than 70 native axial slices and was obtained with five 15 second breath-holds (R: right, L: left, A: anterior, P: posterior, I: inferior, S: superior). Rendering created with 3DSlicer software.

References

    1. Flegal KM, Carroll MD, Ogden CL, Curtin LR. Prevalence and trends in obesity among US adults, 1999–2008. JAMA. 2010;303(3):235–241. - PubMed
    1. Bjorntorp P. Metabolic implications of body fat distribution. Diabetes Care. 1991;14(12):1132–1143. - PubMed
    1. Choudhary AK, Donnelly LF, Racadio JM, Strife JL. Diseases associated with childhood obesity. AJR Am J Roentgenol. 2007;188(4):1118–1130. - PubMed
    1. Despres JP, Lemieux I, Bergeron J, Pibarot P, Mathieu P, Larose E, Rodes-Cabau J, Bertrand OF, Poirier P. Abdominal obesity and the metabolic syndrome: contribution to global cardiometabolic risk. Arterioscler Thromb Vasc Biol. 2008;28(6):1039–1049. - PubMed
    1. Ellis KJ. Human body composition: in vivo methods. Physiol Rev. 2000;80(2):649–680. - PubMed

Publication types