. 2011 Jan 18;8(1):5.
doi: 10.1186/2045-8118-8-5.

The pulsating brain: A review of experimental and clinical studies of intracranial pulsatility

Affiliations

The pulsating brain: A review of experimental and clinical studies of intracranial pulsatility

Mark E Wagshul et al. Fluids Barriers CNS. .

Abstract

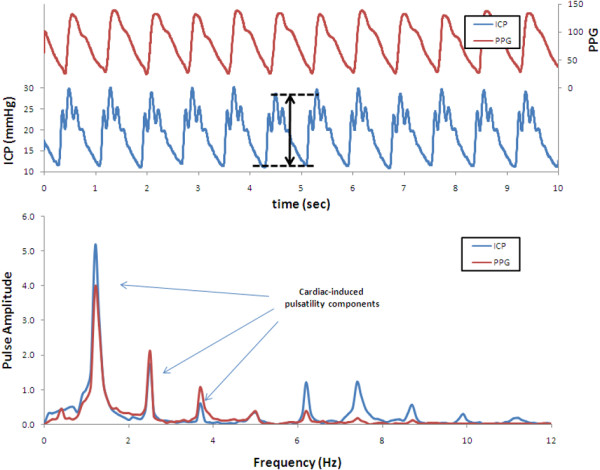
The maintenance of adequate blood flow to the brain is critical for normal brain function; cerebral blood flow, its regulation and the effect of alteration in this flow with disease have been studied extensively and are very well understood. This flow is not steady, however; the systolic increase in blood pressure over the cardiac cycle causes regular variations in blood flow into and throughout the brain that are synchronous with the heart beat. Because the brain is contained within the fixed skull, these pulsations in flow and pressure are in turn transferred into brain tissue and all of the fluids contained therein including cerebrospinal fluid. While intracranial pulsatility has not been a primary focus of the clinical community, considerable data have accrued over the last sixty years and new applications are emerging to this day. Investigators have found it a useful marker in certain diseases, particularly in hydrocephalus and traumatic brain injury where large changes in intracranial pressure and in the biomechanical properties of the brain can lead to significant changes in pressure and flow pulsatility. In this work, we review the history of intracranial pulsatility beginning with its discovery and early characterization, consider the specific technologies such as transcranial Doppler and phase contrast MRI used to assess various aspects of brain pulsations, and examine the experimental and clinical studies which have used pulsatility to better understand brain function in health and with disease.


Figures

Figure 1
Figure 1
Pressure and flow compartments in the brain. Illustration of the pressure and flow "compartments" considered throughout the paper. Pressure can be measured anywhere within the cranium, and both mean pressure as well as pulse amplitude are generally considered to be position-independent. From a technical standpoint, however, pressure measurement is usually restricted to the lateral ventricles, cisternum magnum or the brain parenchyma. Flow, on the other hand, varies considerably with both magnitude (i.e., mean flow) and pulsatility strongly depending on fluid type (e.g., arterial blood vs. CSF) and on location. The figure indicates typical locations for CSF flow measurement. Blood velocity measurements (not shown) are generally restricted to the larger inlet/outlet vessels of the cranium (e.g., carotid, basilar, middle cerebral arteries, sagittal and straight sinuses).
Figure 2
Figure 2
The normal exponential pressure-volume relationship of the cranium. The increase in pressure pulsatility with increased mean pressure is a result of the relationship between pressure and volume, which follows an exponential curve. At normal intracranial pressure (ICP) levels, the increase of intracranial blood volume in systole leads to a small increase in intracranial pressure, hence a normally small intracranial pulse wave (lower waveform, typical amplitude ~ 1 mmHg). With increases in intracranial pressure, the concurrent reduction in intracranial compliance leads to a dramatic increase in the pulse wave, even with no change in the arterial pressure wave (upper waveform). The intracranial pressure-volume curve was first introduced by Marmarou et al in 1975 [3], from which this figure was adapted.
Figure 3
Figure 3
Single pulse waves using the three primary methods reviewed in this paper. Most noteworthy are the morphological differences between these waveforms, with the ICP pulse illustrating significant inter-pulse variations (known as P1, P2 and P3), mostly a result of pressure changes from the opening and closing of the cardiac valves, which are missing or attenuated in the middle cerebral artery blood flow waveform measured with transcranial Doppler ultrasound (middle panel), or in the aqueductal CSF flow waveform measured with phase contrast MRI (right panel). The marked reduction in temporal resolution with MRI as compared to ICP or TCD is also evident, and is due to the fact that MRI information is image-based and therefore much slower than single-point measurement techniques; the flow waveform data are acquired over many minutes and a single pulse wave is generated by averaging over many cardiac cycles.
Figure 4
Figure 4
Examples of pressure wave recordings. An example of mean wave amplitude measurements taken from a clinical case at Oslo University Hospital, and showing simultaneous intracranial pressure (upper) and radial artery pressure (lower) waveforms. Automatic detection of pressure peaks and valleys allows for automated calculation of mean pressure, pulse amplitude (mean wave amplitude), and pulse latency (relative to the radial artery pulse pressure, 80 ms in this case).
Figure 5
Figure 5
Example of time- and frequency-domain pressure recordings. In most clinical applications, data are presented, and analyzed, in the time domain (upper panel). In this case, the pressure is plotted as a function of time. In this example, the mean pressure (5.9 mmHg) as well as the pulse pressure (2.7 mmHg) can be extracted from the plot, although there can be confounding modulation of the pulse pressure from other sources such as respiration. Timing information can be extracted from the difference in timing of the peaks or troughs of the signal compared to the reference waveform (PPG, photoplethysmograph, in this case). In comparison, pressure data analyzed in the frequency domain is represented as a function of frequency (lower panel), and the signal now has well defined cardiac components which are easily separated from the low frequency components such as respiration and can be analyzed independently. Additional information available with frequency-domain analysis is the phase, the frequency-domain analog of timing in the time-domain (not shown). The phase plot allows analysis of timing differences between the ICP and the reference waveform for each identified frequency component.
Figure 6
Figure 6
Example of MRI flow waveforms in the cerebral aqueduct. A typical MRI-derived flow waveform, demonstrating the possible measures extracted for quantification. Stroke volume is the most common parameter used, and is a measure of the net flow through the vessel/region of interest, in one direction (i.e., over approximately half the cardiac cycle). Flow rate has also been used frequently, and is the mean flow rate for flow in one direction. Peak flow is used less frequently, and is a measure of the highest (i.e., systolic, or lowest for diastolic) flow rate over the entire cardiac cycle.
Figure 7
Figure 7
Timing aspects of the intracranial and arterial pressure waveforms. Single-pulse intracranial and arterial blood pressure waveforms, showing the elements of pulse wave timing. Timing can either be calculated intrinsically within the intracranial pulse wave, such as with the systolic/diastolic timing difference (dT) or the slope of intracranial pulse wave (dP/dT), or it can be measured relative to a reference pulse wave, such as the latency between the peaks of the ICP and the ABP waves.
Figure 8
Figure 8
Systems analysis of the intracranial pulse pressure and the concept of transfer function. Because the intracranial pressure wave is a complex result of both the shape of the incoming arterial pressure wave, as well as the biomechanics of the intracranial compartment, additional analysis is needed to extract information about the biomechanics of the intracranial system independent of pressure waveform morphology. In systems analysis, the concept of transfer function is used to accomplish this. In these experiments, both arterial and intraparenchymal pressure were measured. The frequency-domain transfer function relates these two waveforms, i.e. how does the system (the cranium) transform the input (arterial pressure) into the output (parenchymal pressure)? This work showed the existence of a "notch" in the transfer function specifically in the vicinity of the heart rate (dip in signal seen in the lower right-hand corner) indicating minimal transmission of the fundamental cardiac frequency from the arterial pressure into the parenchymal pressure. However, under conditions of raised ICP through CSF volume loading, this notch disappears (reddish area just above the lower right corner, coincident with the increase in ICP seen in the blue curve) because of the increase in the fundamental cardiac frequency component of the intracranial pressure wave (figure reproduced with permission, with modifications, from Zou et al [73]).
Figure 9
Figure 9
Rounding of the intracranial pulse wave as a result of increased ICP. Elevated ICP leads to decreased intracranial compliance, which investigators have found to result in amplification of the lower harmonic content of the intracranial pulse pressure wave, relative to the higher harmonic component. This behavior appears as a rounding of the pulse wave demonstrated here by CSF volume loading in the dog (upper panel: normal ICP levels, lower panel: raised ICP condition). The data also illustrate the timing, or phase, difference between the ABP and ICP waveforms, and the phase change with changes with mean ICP (figure reproduced with permission from Wagshul et al [74]).
Figure 10
Figure 10
The effect of shunting on mean pulse wave amplitude. Mean amplitude of the pulse pressure wave has been used both as an indication of disease severity and as an indicator of the likelihood of shunt success in hydrocephalus. In this patient, it can be seen that not only is the mean wave amplitude dramatically reduced following shunting (leftmost vs. rightmost column, middle row), but that it is also a sensitive means of adjusting the shunt valve opening pressure (four central columns, middle row, figure reproduced with permission from Eide and Sorteberg [25]).
Figure 11
Figure 11
Correlation between pressure and pulse amplitude (RAP). The RAP concept can best be understood through this figure showing the expected pulse amplitude behavior with increasing ICP. Under normal ICP conditions (left), the shallow slope of the pressure-volume curve leads to a weak relationship between pulse amplitude and pressure; RAP is close to zero. As ICP rises (middle), and with it the slope of the pressure-volume response, there is a clear positive correlation between pulse amplitude and mean pressure; as pressure rises, so does pulse pressure, resulting in an RAP close to 1. This relationship indicates a loss of compensatory reserve in the pressure-volume response. Finally, when ICP reaches a critical point (right), the slope of the pressure-volume curve decreases sharply resulting in a negative pulse amplitude-pressure relationship; RAP becomes negative. In TBI, negative RAP has been shown to predict patients who are unlikely to recover (figure reproduced with permission from Czosnyka and Pickard [200]).
Figure 12
Figure 12
The importance of intracranial compliance in hydrocephalus management. In this work, intraventricular infusion tests were used to measure the slope of the pressure-volume curve. From this, the authors derive an intracranial elastance index - not the absolute elastance because they use diastolic pressures rather than mean pressure in the calculations - which is shown here to provide excellent separation between patients who improved (white) and those who did not improve (blue) following shunting. The elastance index used here is proportional to the inverse of intracranial compliance (figure reproduced with permission from Anile et al [129]).
Figure 13
Figure 13
Flow in the cerebral aqueduct from cine phase contrast MRI in a healthy control. A typical MRI flow study, using the phase contrast technique, consists of the magnitude (a, anatomical) and phase (b, flow) image. In this example, cine images were taken as a function of the cardiac cycle by gating the image acquisition to a peripheral pulse signal. The image on the right depicts flow velocities during one phase of the cardiac cycle with caudal CSF flow (the bright dot in center of the image shows caudal flow in the aqueduct during this phase of the cycle). By summing over all pixels in the aqueduct, a net flow waveform is obtained (c). Stroke volume in this instance was 25.7 μl.
Figure 14
Figure 14
Temporal changes in aqueductal stroke volume in unshunted HC patients. Evidence that CSF flow can change over time with untreated disease may explain the difficulty clinicians have had using this measure for predicting shunt outcome. In this study, nine patients who had refused a shunt were followed over the course of four years (the time axis has been normalized for each patient, so that 0 months corresponds to the time of the first reported symptoms). The time at which MRI measurements are taken may play a critical role in their prognostic use for predicting shunt outcome. Normal stroke volume may only be indicative of poor shunt-responsiveness if taken at later time when stroke volume has decreased, perhaps due to irreversible atrophic changes in the brain which cannot be remedied with shunting. Normal stroke volume during the early development stages of the disease, on the other hand, may simply be an indication that intracranial compliance has not yet changed sufficiently to affect aqueductal flow patterns, and shunting may still prove effective in this patient group (figure reproduced with permission from Scollato et al [165]).

References

    1. Eide PK. Comparison of simultaneous continuous intracranial pressure (ICP) signals from ICP sensors placed within the brain parenchyma and the epidural space. Med Eng Phys. 2008;30:34–40. doi: 10.1016/j.medengphy.2007.01.005. - DOI - PubMed
    1. Eide PK, Saehle T. Is ventriculomegaly in idiopathic normal pressure hydrocephalus associated with a transmantle gradient in pulsatile intracranial pressure? Acta Neurochir (Wien) 2010;152(6):989–95. doi: 10.1007/s00701-010-0605-x. - DOI - PubMed
    1. Marmarou A, Shulman K, LaMorgese J. Compartmental analysis of compliance and outflow resistance of the cerebrospinal fluid system. J Neurosurg. 1975;43:523–534. doi: 10.3171/jns.1975.43.5.0523. - DOI - PubMed
    1. Sato E, Feke GT, Menke MN, Wallace McMeel J. Retinal haemodynamics in patients with age-related macular degeneration. Eye (Lond) 2006;20:697–702. - PubMed
    1. Moritani T, Crouse SF, Shea CH, Davidson N, Nakamura E. Arterial pulse wave velocity, Fourier pulsatility index, and blood lipid profiles. Med Sci Sports Exerc. 1987;19:404–409. - PubMed

LinkOut - more resources