

Variability and misclassification of worker estimated hand force
- PMID: 21349496
- PMCID: PMC3123417
- DOI: 10.1016/j.apergo.2011.01.008
Variability and misclassification of worker estimated hand force
Abstract
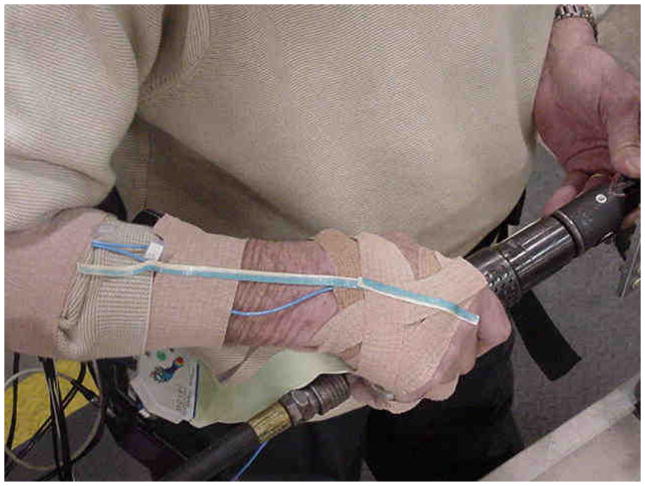
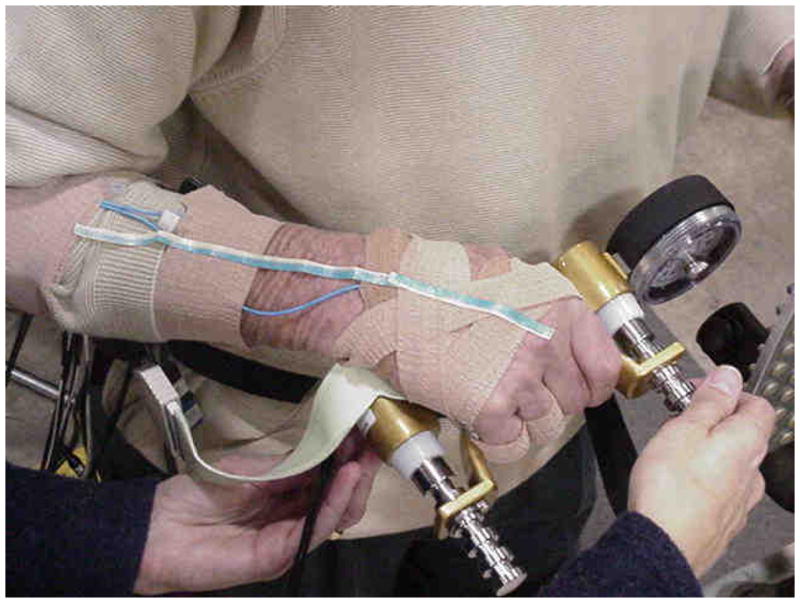
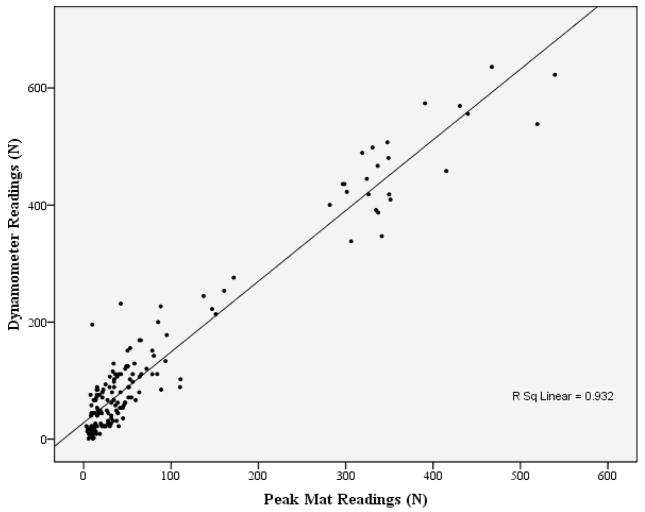
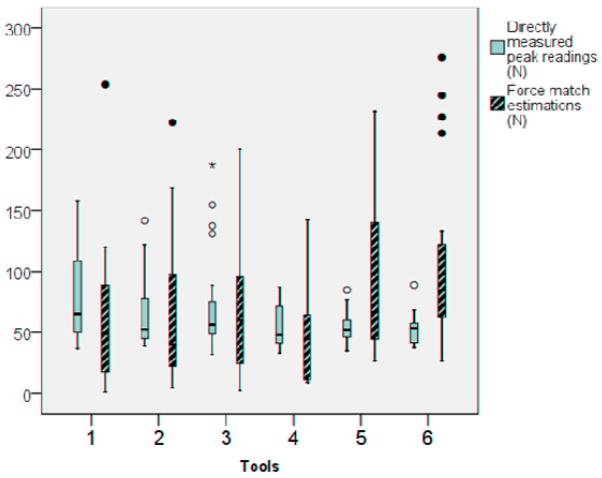
Ergonomic studies often use worker estimated hand force reproduced on a dynamometer to quantify force exposures but this method has not been well-studied in real work settings. This study evaluated the validity of worker estimates of hand force in a field study and determined the misclassification of worker estimated hand force exposures compared to directly measured forces. Eight experienced sheet metal assemblers completed ¼-inch diameter fastener installations using 6 different pneumatic tools. Grip forces were recorded by a pressure mat and were compared to worker estimated forces demonstrated on a dynamometer. Directly measured and worker estimated readings showed moderate correlations (0.53-0.67) for four installation tools and fair to moderate for two tools. The coefficient for variation of force estimates was 65% within repeated subject trials and 78% between averaged subject trials but 69% between subject trials during actual tool installations. Misclassification of worker estimated exposures varied by two cut-points: 29% using 4.0 kg and 49% using 6.0 kg. The force match procedure may provide adequate differentiation of high and low exposures in some settings, but is likely to result in substantial misclassification in other settings.
Copyright © 2011 Elsevier Ltd and The Ergonomics Society. All rights reserved.
Figures
References
-
- Bao S, Silverstein B. Estimation of hand force in ergonomic job evaluations. Ergonomics. 2005;48:288–301. - PubMed
-
- Bao S, Silverstein B, Howard N, Spielholz P. The Washington state SHARP approach to exposure assessment. In: Marras WS, Karwowski W, editors. The Occupational Ergonomics Handbook. 2. Boca Raton, FL: CRC Taylor and Francis Group; 2006.
-
- Borg G. Psychophysical scaling with application in physical work and the perception of exertion. Scand j Work Environ Health. 1990;16(suppl I):55–8. - PubMed
-
- Burdorf A. Bias in risk estimates from variability of exposure to postural load on the back in occupational groups. Scand J Work Environ Health. 1993;19:50–4. - PubMed
Publication types
MeSH terms
Grants and funding
LinkOut - more resources
Full Text Sources
