. 2011 Apr 15;286(15):13244-54.
doi: 10.1074/jbc.M110.206615. Epub 2011 Feb 24.

A critical role of Gbetagamma in tumorigenesis and metastasis of breast cancer

Affiliations

A critical role of Gbetagamma in tumorigenesis and metastasis of breast cancer

Xiaoyun Tang et al. J Biol Chem. .

Abstract

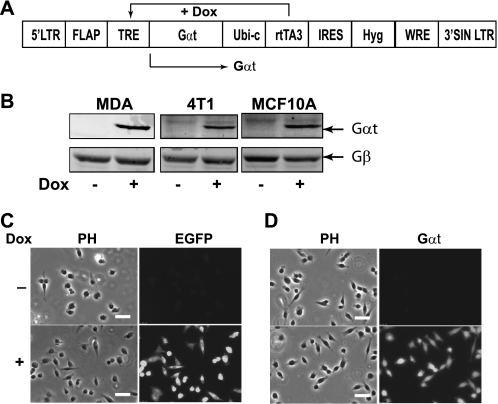
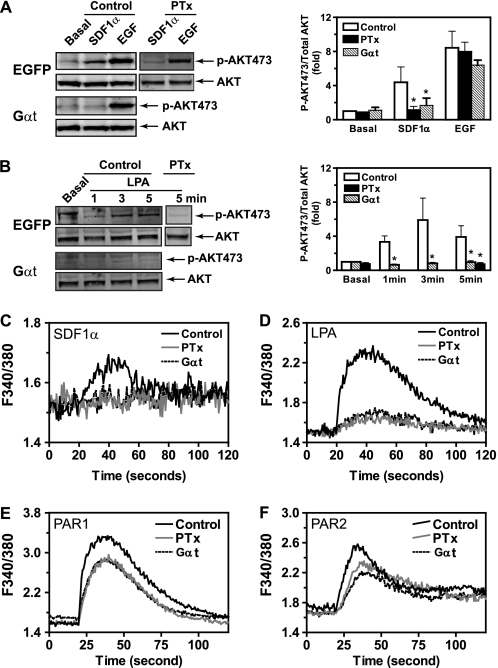
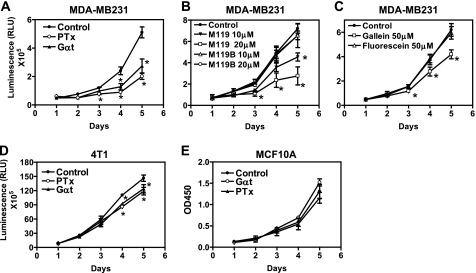
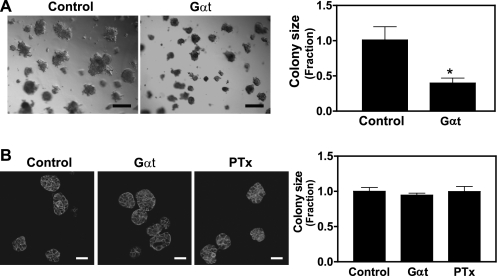
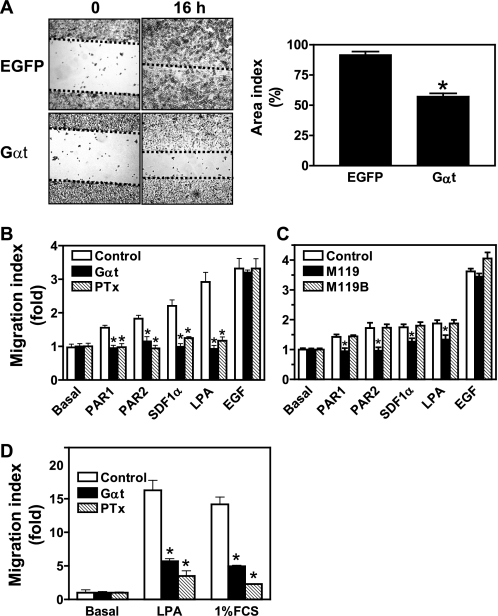
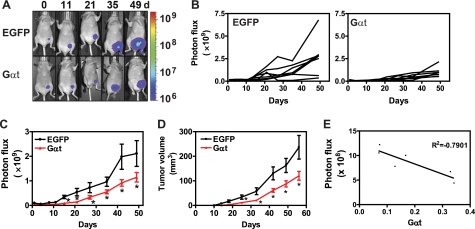
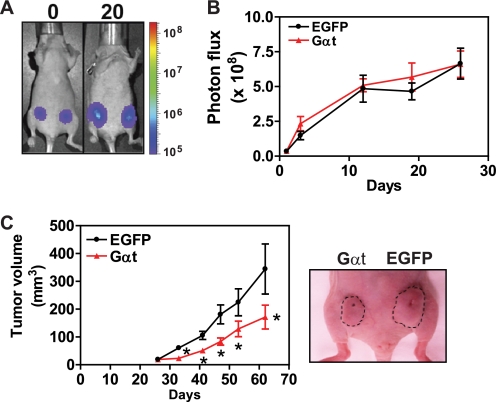
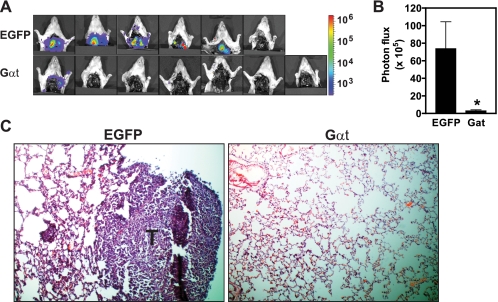
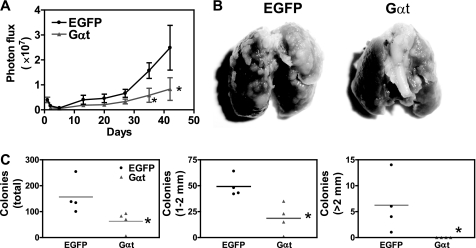
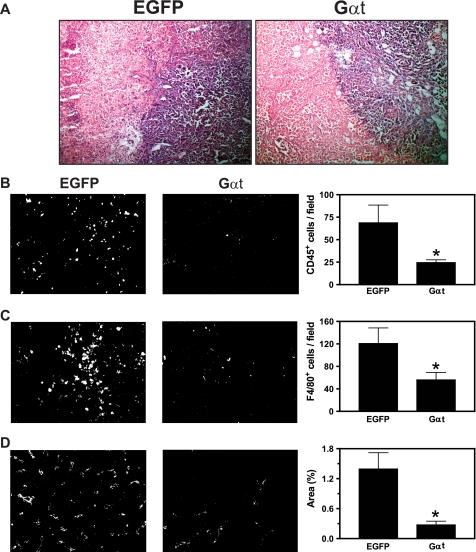
A growing body of evidence indicates that G protein-coupled receptors (GPCRs) are involved in breast tumor progression and that targeting GPCRs may be a novel adjuvant strategy in cancer treatment. However, due to the redundant role of multiple GPCRs in tumor development, it may be necessary to target a common signaling component downstream of these receptors to achieve maximum efficacy. GPCRs transmit signals through heterotrimeric G proteins composed of Gα and Gβγ subunits. Here we evaluated the role of Gβγ in breast tumor growth and metastasis both in vitro and in vivo. Our data show that blocking Gβγ signaling with Gα(t) or small molecule inhibitors blocked serum-induced breast tumor cell proliferation as well as tumor cell migration induced by various GPCRs in vitro. Moreover, induced expression of Gα(t) in MDA-MB-231 cells inhibited primary tumor formation and retarded growth of existing breast tumors in nude mice. Blocking Gβγ signaling also dramatically reduced the incidence of spontaneous lung metastasis from primary tumors and decreased tumor formation in the experimental lung metastasis model. Additional studies indicate that Gβγ signaling may also play a role in the generation of a tumor microenvironment permissive for tumor progression, because the inhibition of Gβγ signaling attenuated leukocyte infiltration and angiogenesis in primary breast tumors. Taken together, our data demonstrate a critical role of Gβγ signaling in promoting breast tumor growth and metastasis and suggest that targeting Gβγ may represent a novel therapeutic approach for breast cancer.


Figures

FIGURE 1.
FIGURE 1.
Induced expression of EGFP and Gαt in MDA-MB-231, 4T1, and MCF10A stable cell lines. A, schematic of the lentiviral vector used for doxycycline-induced expression of Gαt. B, expression of Gαt in MDA-MB-231, 4T1, and MCF10A cells transduced with pSLIK-Gαt lentivirus. Gαt expression was induced by doxycycline (1 μg/ml) for 3 days and analyzed by Western blotting. C and D, induced expression of EGFP (C) and Gαt (D) in MDA-MB-231 cells by doxycycline (Dox) treatment. Gαt expression was revealed by staining cells with anti-Gαt antibody, followed by Alexa-488-conjugated secondary antibody. Phase contrast (PH) and fluorescent images are shown. Scale bar, 50 μm.
FIGURE 2.
FIGURE 2.
t selectively inhibits Gβγ-mediated signaling. A and B, effects of induced Gαt expression on SDF1α-stimulated (A) and LPA-stimulated (B) AKT phosphorylation. MDA-MB-231 cells were treated with doxycycline for 3 days to induce EGFP (Control) or Gαt expression. AKT phosphorylation stimulated by SDF1α (50 nm), LPA (10 μm), and EGF (100 ng/ml) was then determined by Western blotting analyses. To determine the effect of PTx, MDA-MB-231 cells expressing EGFP were pretreated with PTx (200 ng/ml) overnight. Representative images are shown on the left, and quantitative data are shown on the right (n = 4–5). C–F, effects of induced Gαt expression on Ca2+ signaling stimulated by SDF1α (C), LPA (D), PAR1 (E), and PAR2 (F) agonist peptides. MDA-MB-231 cells expressing inducible Gαt were treated with either buffer (Control), PTx overnight (PTx), or doxycycline for 3 days to induce Gαt expression (Gαt) and then stimulated with SDF1α (50 nm), LPA (10 μm), PAR1 (10 μm), and PAR2 (10 μm) agonist peptides. The increase in [Ca2+]i was measured using Fura-2/AM. Representative data from 3–4 independent experiments are shown. *, p < 0.05 indicates significance versus control.
FIGURE 3.
FIGURE 3.
Blocking Gβγ signaling inhibits breast tumor cell growth. Effects of Gαt expression and treatment with PTx or small molecule inhibitors of Gβγ on the proliferation of MDA-MB-231 (A–C), 4T1 (D), and MCF10A (E) in the complete growth medium containing 10% FBS. The dose of PTx used was 200 ng/ml. The indicated concentrations of M119, M119B, gallein, and fluorescein were added to the growth medium and replenished every day. *, p < 0.05 indicates significance versus control. n = 4–6. Error bars, S.E.
FIGURE 4.
FIGURE 4.
Effects of blocking Gβγ signaling on MDA-MB-231 and MCF10A cell growth in three-dimensional culture. MDA-MB-231 (A) and MCF10A (B) cells were cultured in matrigel in the absence (Control) or presence of PTx (200 ng/ml) or doxycycline to induce Gαt expression (Gαt) for 8 days. MCF10 cells were fixed and stained with Alexa568-conjugated phalloidin. Representative phase-contrast images of MDA-MB-231 (A) and fluorescent images of MCF10A (B) cells are shown on the left. Quantitative data showing the size of MDA-MB-231 (A) and MCF10A (B) colonies are shown on the right. Data are expressed as the fraction of the size of the colonies derived from the control cells. Scale bar in A, 200 μm. Scale bar in B, 50 μm. *, p < 0.05 indicates significance versus control. n = 3.
FIGURE 5.
FIGURE 5.
Inhibition of Gβγ signaling blocks breast tumor cell migration. MDA-MB-231 (A–C) and 4T1 cells (D) were treated with either PTx overnight, doxycycline for 3 days to induce Gαt expression (Gαt), or small molecule inhibitors of Gβγ for 30 min to block Gβγ signaling. The effects on cell migration were determined by the ability of cells to close a wound in a wound healing assay (A) or to migrate toward a concentration gradient of chemoattractants, SDF1α (100 nm), LPA (1 μm), PAR1 (10 μm), and PAR2 (10 μm) agonist peptides, 1% FBS, and EGF (100 ng/ml), in the transwell assays. *, p < 0.05 indicates significance versus control. n = 3–5. Error bars, S.E.
FIGURE 6.
FIGURE 6.
Blocking Gβγ signaling via induced Gαt expression inhibits tumor growth in mice. MDA-MB-231 cells expressing luciferase and inducible EGFP or Gαt were first treated with doxycycline for 3 days and then implanted into the inguinal mammary fat pads of nude mice (n = 7). Tumor growth was monitored by bioluminescence imaging and caliper measurement. A, representative bioluminescence images at the indicated times postinjection with MDA-MB-231 cells expressing EGFP or Gαt. Each set of images was taken from the same mouse. B and C, individual (B) and average tumor growth rate (C) as reflected by total photon flux. D, tumor growth rate as determined by caliper measurement. E, inverse correlation between the level of Gαt expression and the size of tumors as reflected by total photon influx. The level of Gαt expression was normalized to the total amount of protein loaded. *, p < 0.05 indicates significance versus EGFP control. Error bars, S.E.
FIGURE 7.
FIGURE 7.
Induced Gαt expression reduces existing tumor growth. MDA-MB-231 cells expressing luciferase and inducible EGFP or Gαt were implanted to the right and left inguinal mammary fat pads of mice (n = 7), respectively, and were allowed to grow for 23 days before the mice were treated with doxycycline to induce EGFP and Gαt expression. Tumor growth was monitored by bioluminescence imaging and caliper measurement. Shown are representative bioluminescence images (A) and average tumor growth rate (B) before EGFP and Gαt induction at the indicted times postinjection. C, tumor growth rate after induced EGFP and Gαt expression, as determined by caliper measurement. Right, a representative image of one mouse bearing tumors derived from EGFP- and Gαt-expressing cells. The size of the tumors is indicated. *, p < 0.05 indicates significance versus EGFP control. Error bars, S.E.
FIGURE 8.
FIGURE 8.
Induced Gαt expression prevents spontaneous lung metastasis. As indicted in the legend to Fig. 6, mice were inoculated with the indicated MDA-MB-231 cells. Tumors were removed after reaching a volume of 300 mm3. Lung metastasis was monitored by postmortem ex vivo BLI 2 weeks after removal of the primary tumor (A and B) and verified by histological analysis of lung sections (C). Bioluminescence (A) and representative H&E staining (C) images and mean intensity of lung metastasis signal (B), as reflected by the total photon flux, are shown. n = 7. *, p < 0.05 indicates significance versus EGFP control. Error bars, S.E.
FIGURE 9.
FIGURE 9.
Induced Gαt expression reduced tumor formation in the experimental lung metastasis model. MDA-MB-231 cells were injected into the mice (n = 6) via the tail vein to generate lung metastases. Mice were treated with doxycycline to induce EGFP or Gαt expression 1 day postinjection. Tumor formation in the lung was monitored by BLI weekly (A). At week 9, mice were sacrificed, and the surface tumors on the isolated lung were counted and grouped based on their size (1–2 mm or bigger than 2 mm in diameter) (C). Representative images of the lungs from mice injected with the indicated tumor cells are shown in B. T, tumor cells. *, p < 0.05 indicates significance versus EGFP control. Error bars, S.E.
FIGURE 10.
FIGURE 10.
Inhibition of Gβγ signaling reduced leukocyte infiltration and angiogenesis. Frozen tumor sections were prepared from mice inoculated with MDA-MB-231 cells as indicated in the legend to Fig. 7. After fixation, sections were stained with H&E (A), CD45 for common leukocytes (B), F4/80 for macrophages (C), or CD31 for endothelia (D) followed by staining with Alexa568-conjugated secondary antibody. Fluorescence images were taken from five randomly chosen fields of each section, and the positively stained cells were quantified using ImageJ software. Representative images of the indicated tumor sections and the quantitative data are shown in the left and right of each panel, respectively. *, p < 0.05 indicates significance versus EGFP control. n = 7. Error bars, S.E.

References

    1. Coughlin S. S., Ekwueme D. U. (2009) Cancer Epidemiol. 33, 315–318 - PubMed
    1. Jemal A., Siegel R., Xu J., Ward E. (2010) CA Cancer J. Clin. 60, 277–300 - PubMed
    1. Dorsam R. T., Gutkind J. S. (2007) Nat. Rev. Cancer 7, 79–94 - PubMed
    1. Schmid B. C., Rudas M., Rezniczek G. A., Leodolter S., Zeillinger R. (2004) Breast Cancer Res. Treat. 84, 247–250 - PubMed
    1. Cabioglu N., Sahin A., Doucet M., Yavuz E., Igci A. O., Yildirim E., Aktas E., Bilgic S., Kiran B., Deniz G., Price J. E. (2005) Clin. Exp. Metastasis 22, 39–46 - PubMed

Publication types

MeSH terms

Substances