. 2011 Apr 22;286(16):14493-507.
doi: 10.1074/jbc.M111.218701. Epub 2011 Feb 24.

Emerging paradigms for the initiation of mucin-type protein O-glycosylation by the polypeptide GalNAc transferase family of glycosyltransferases

Affiliations

Emerging paradigms for the initiation of mucin-type protein O-glycosylation by the polypeptide GalNAc transferase family of glycosyltransferases

Thomas A Gerken et al. J Biol Chem. .

Abstract

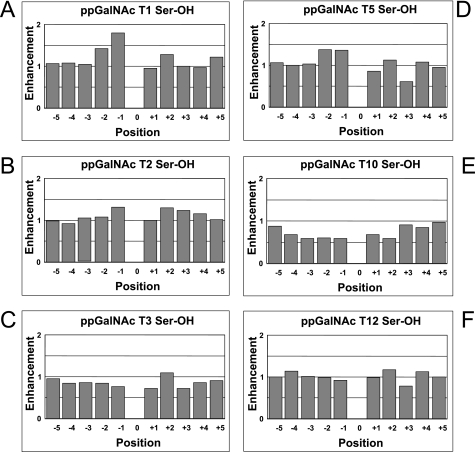
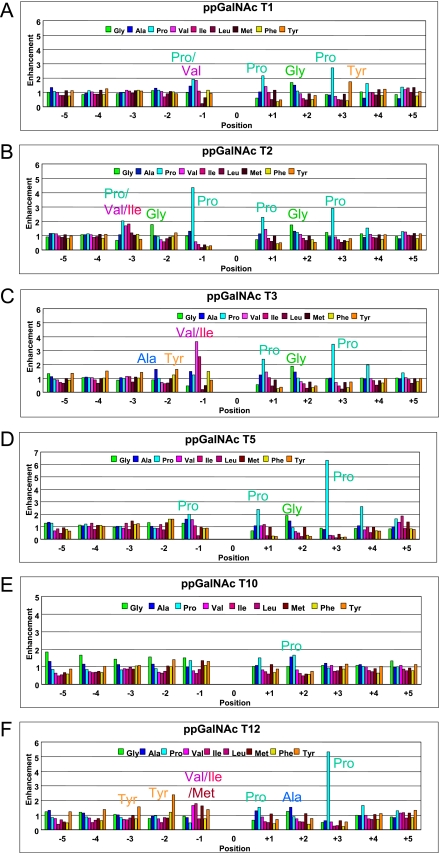
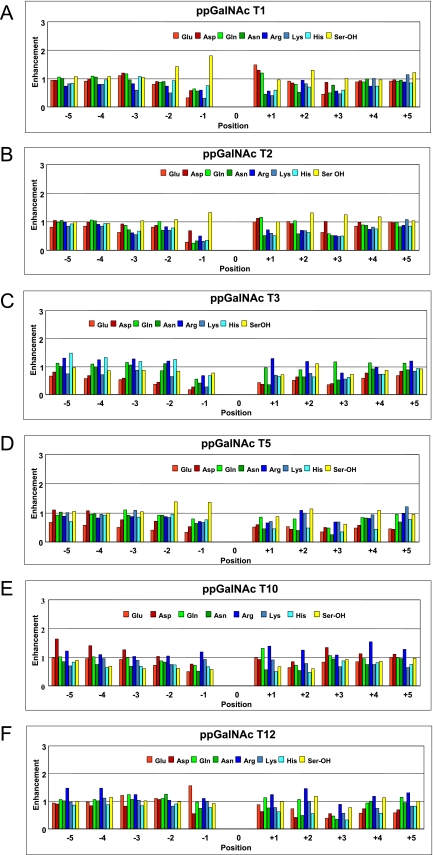
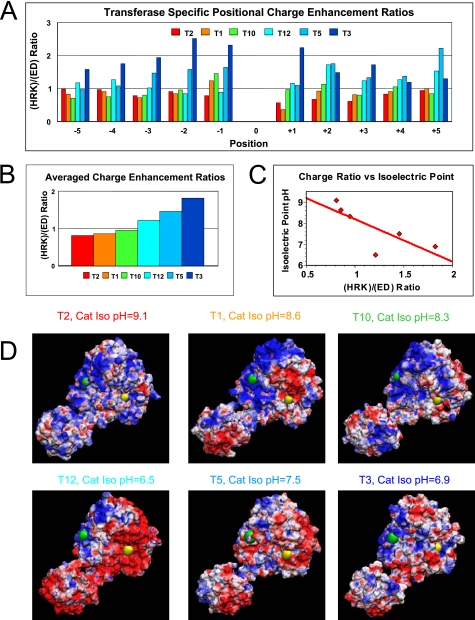
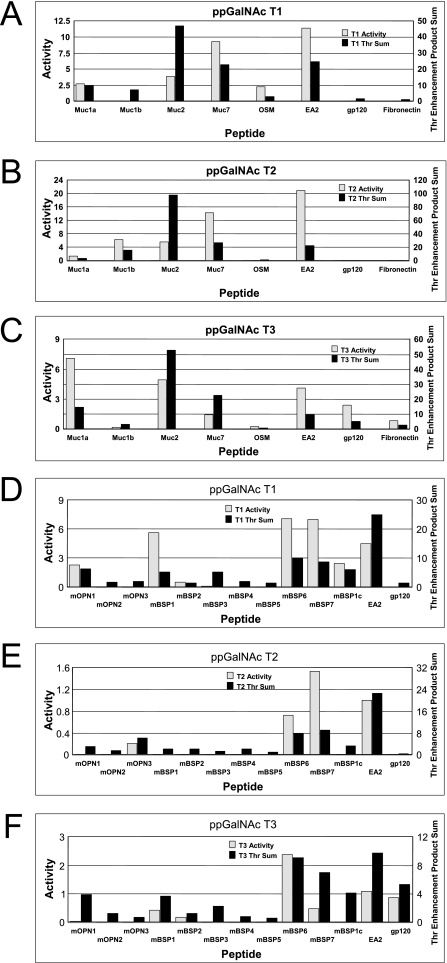
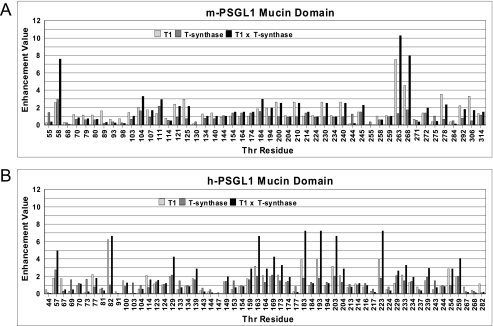
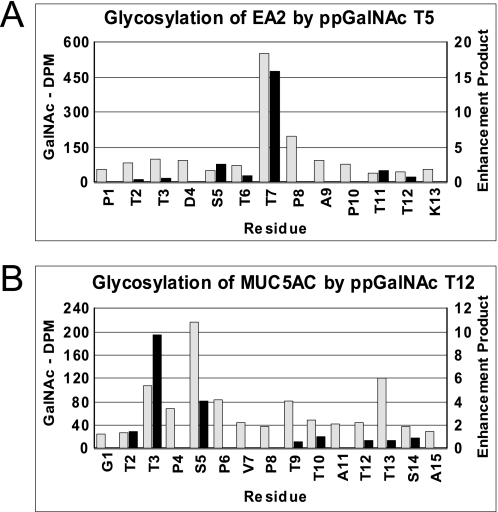
Mammalian mucin-type O-glycosylation is initiated by a large family of ∼20 UDP-GalNAc:polypeptide α-N-acetylgalactosaminyltransferases (ppGalNAc Ts) that transfer α-GalNAc from UDP-GalNAc to Ser and Thr residues of polypeptide acceptors. Characterizing the peptide substrate specificity of each isoform is critical to understanding their properties, biological roles, and significance. Presently, only the specificities of ppGalNAc T1, T2, and T10 and the fly orthologues of T1 and T2 have been systematically characterized utilizing random peptide substrates. We now extend these studies to ppGalNAc T3, T5, and T12, transferases variously associated with human disease. Our results reveal several common features; the most striking is the similar pattern of enhancements for the three residues C-terminal to the site of glycosylation for those transferases that contain a common conserved Trp. In contrast, residues N-terminal to the site of glycosylation show a wide range of isoform-specific enhancements, with elevated preferences for Pro, Val, and Tyr being the most common at the -1 position. Further analysis reveals that the ratio of positive (Arg, Lys, and His) to negative (Asp and Glu) charged residue enhancements varied among transferases, thus further modulating substrate preference in an isoform-specific manner. By utilizing the obtained transferase-specific preferences, the glycosylation patterns of the ppGalNAc Ts against a series of peptide substrates could roughly be reproduced, demonstrating the potential for predicting isoform-specific glycosylation. We conclude that each ppGalNAc T isoform may be uniquely sensitive to peptide sequence and overall charge, which together dictates the substrate sites that will be glycosylated.


Figures

FIGURE 1.
FIGURE 1.
Random peptide-derived ppGalNAc T serine residue enhancement factors. Serine enhancement factors for ppGalNAc T1 (panel A), T2 (panel B), T3 (panel C), T5 (panel D), T10 (panel E), and T12 (panel F) are relative to the site of glycosylation (position 0). Negative positions are N-terminal, although positive positions are C-terminal to the site of glycosylation. Values represent the average of two or more determinations on random peptide P-VIII (Table 1) as described under “Experimental Procedures.” Enhancement values of less than 1 indicate decreased preference, although values greater than 1 indicate increased preference for the given residue by the transferase.
FIGURE 2.
FIGURE 2.
Random peptide-derived hydrophobic residue enhancement factors. Hydrophobic amino acid residues, including Gly, enhancement factors for ppGalNAc T1 (panel A), T2 (panel B), T3 (panel C), T5 (panel D), T10 (panel E), and T12 (panel F) were obtained from random peptides P-VI, P-VII, and P-VIII (Table 1). Note that factors for ppGalNAc T1, T2 (panel B), and T10 include previously reported random peptide data for P-VI and P-VII (30, 47, 48). Key common and unique amino acid residues are labeled.
FIGURE 3.
FIGURE 3.
Random peptide-derived hydrophilic residue enhancement factors. Hydrophilic amino acid residue enhancement factors for ppGalNAc T1 (panel A), T2 (panel B), T3 (panel C), T5 (panel D), T10 (panel E), and T12 (panel F) were obtained from random peptides P-VI, P-VII, and P-VIII (Table 1). Note that factors for ppGalNAc T1, T2 (panel B), and T10 include previously reported random peptide data for P-VI and P-VII (30, 47, 48).
FIGURE 4.
FIGURE 4.
Transferase-specific charged residue enhancement ratios ((HRK)/(ED) ratio) roughly correlate with calculated isoelectric point and electrostatic surface charge. Panels A and B, plots of experimental charged residue enhancement ratios for each transferase as a function of position (panel A) or averaged over all positions (panel B). Panel C, plot of charged residue enhancement value versus catalytic domain isoelectric point. Line represents least squares fit to the data. Panel D, homology-modeled structures of the ppGalNAc Ts colored by surface electrostatic charge (red, negative charge; blue, positive charge). The catalytic domain is located at the upper right, and the lectin domain is at the lower left of each panel. The approximate catalytic domain peptide substrate-binding cleft is marked by green and yellow spheres representing an N- to C-terminal orientation based on the substrate peptide-bound x-ray structure of ppGalNAc T2 (22). See under “Experimental Procedures” for details.
FIGURE 5.
FIGURE 5.
Transferase-specific threonine enhancement products roughly correlate with experimental transferase activity. Panels A–C, plots of glycosyltransferase activity (gray) and transferase-specific Thr enhancement product sums (black) for the peptides Muc1a, Muc1b, Muc2, Muc7, OSM, EA2, gp120, and fibronectin whose activity against ppGalNAc T1 (panel A), ppGalNAc T2 (panel B), and ppGalNAc T3 (panel C) was taken from Bennett et al. (65). Peptide sequences for panels A–C are defined in supplemental Table 1. Panels D–F, plots of glycosyltransferase activity (gray) and transferase-specific Thr enhancement product sums (black) for the peptides mOPN1 to mOPN3, mBSP1 to mBSP7, EA2, and gp120 whose activity against ppGalNAc T1 (panel D), ppGalNAc T2 (panel E), and ppGalNAc T3 (panel F) was taken from Miwa et al. (63). Peptide sequences for panels D–F are defined in supplemental Table 2. Enhancement value products were obtained as described under “Experimental Procedures.”
FIGURE 6.
FIGURE 6.
ppGalNAc T1 and T-synthase random peptide enhancement products for the PSGL1 mucin domain. Plots of the Thr residue enhancement products for ppGalNAc T1 and T-synthase (open bars and gray bars) for the mouse (panel A) and human (panel B) PSGL1 mucin domain. The products of the ppGalNAc T1 and T-synthase enhancement products are also plotted (black bars). Note that the functionally important Thr-57 (mouse) and Thr-58 (human) residues display elevated enhancement values relative to the surrounding Thr residues suggesting these residues would more likely be fully elongated. Enhancement value products were obtained as described under “Experimental Procedures.”
FIGURE 7.
FIGURE 7.
ppGalNAc T5 and T12 enhancement products versus experimentally determined sites of glycosylation. ppGalNAc T5 against EA2 (panel A) and ppGalNAc T12 against MUC5AC (panel B). Gray bars represent experimentally determined [3H]GalNAc incorporation obtained by Edman sequencing (uncorrected for background or sequence lag), and black bars represent random peptide-derived enhancement value products.

References

    1. Tian E., Ten Hagen K. G. (2009) Glycoconj. J. 26, 325–334 - PMC - PubMed
    1. Tabak L. A. (2010) Semin. Cell Dev. Biol. 21, 616–621 - PMC - PubMed
    1. Kato K., Takeuchi H., Kanoh A., Miyahara N., Nemoto-Sasaki Y., Morimoto-Tomita M., Matsubara A., Ohashi Y., Waki M., Usami K., Mandel U., Clausen H., Higashi N., Irimura T. (2010) Glycoconj. J. 27, 267–276 - PubMed
    1. Zhang L., Ten Hagen K. G. (2010) J. Biol. Chem. 285, 34477–34484 - PMC - PubMed
    1. Lee S. H., Yu S. Y., Nakayama J., Khoo K. H., Stone E. L., Fukuda M. N., Marth J. D., Fukuda M. (2010) J. Biol. Chem. 285, 37683–37692 - PMC - PubMed

Publication types