. 2011 Apr;138(7):1309-19.
doi: 10.1242/dev.059451. Epub 2011 Feb 24.

Ribeye is required for presynaptic Ca(V)1.3a channel localization and afferent innervation of sensory hair cells

Affiliations

Ribeye is required for presynaptic Ca(V)1.3a channel localization and afferent innervation of sensory hair cells

Lavinia Sheets et al. Development. 2011 Apr.

Abstract

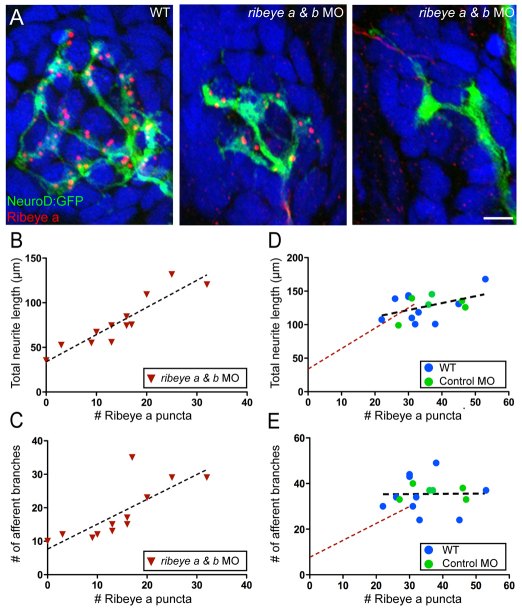
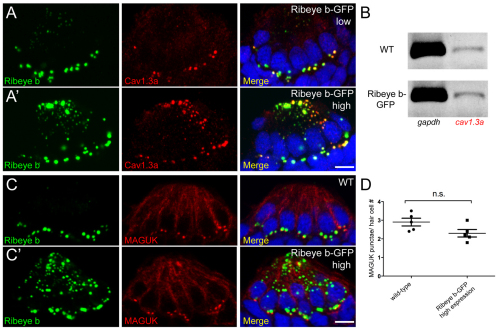
Ribbon synapses of the ear, eye and pineal gland contain a unique protein component: Ribeye. Ribeye consists of a novel aggregation domain spliced to the transcription factor CtBP2 and is one of the most abundant proteins in synaptic ribbon bodies. Although the importance of Ribeye for the function and physical integrity of ribbon synapses has been shown, a specific role in synaptogenesis has not been described. Here, we have modulated Ribeye expression in zebrafish hair cells and have examined the role of Ribeye in synapse development. Knockdown of ribeye resulted in fewer stimulus-evoked action potentials from afferent neurons and loss of presynaptic Ca(V)1.3a calcium channel clusters in hair cells. Additionally, afferent innervation of hair cells was reduced in ribeye morphants, and the reduction was correlated with depletion of Ribeye punctae. By contrast, transgenic overexpression of Ribeye resulted in Ca(V)1.3a channels colocalized with ectopic aggregates of Ribeye protein. Overexpression of Ribeye, however, was not sufficient to create ectopic synapses. These findings reveal two distinct functions of Ribeye in ribbon synapse formation--clustering Ca(V)1.3a channels at the presynapse and stabilizing contacts with afferent neurons--and suggest that Ribeye plays an organizing role in synaptogenesis.


Figures

Fig. 1.
Fig. 1.
ribeye a and ribeye b expression and localization during zebrafish hair-cell development. (A) Expression of ribeye a and ribeye b mRNA in the developing ear and neuromasts. ribeye b is expressed strongly in the otic vesicle at 20 hpf, while ribeye a is expressed after 20 hpf, and at lower levels (black arrowheads). At 52 hpf, ribeye a is detectable in the retina and ear (black arrowhead), whereas ribeye b is expressed in both the ear (black arrowhead) and lateral line neuromasts (black and white arrowheads). Scale bar: 200 μm. (B-E) Representative maximum confocal z-projections of hair cells in wild-type larvae. Scale bars: 3 μm. (B-D) Ribeye immunofluorescent labeling in nascent hair cells in the developing ear at 22 hpf (B), 26 hpf (C) and 28 hpf (D). Ribeye a and Ribeye b proteins form aggregates that, by 26 hpf, are accumulated at the basal end of hair cells (white arrowheads). (E) Ribeye immunofluorescent labeling in a cross-section of a neuromast at 5 dpf. Merged images include DAPI labeling of cell nuclei (blue).
Fig. 2.
Fig. 2.
Morpholino-mediated knockdown of ribeye a and ribeye b in 2-day-old zebrafish larvae. (A-D) Representative confocal z-projections of Ribeye a (red) and Ribeye b (green) immunolabel in neuromast hair cells of wild-type (A), ribeye a morphant (B), ribeye b morphant (C), and ribeye a and ribeye b morphant larvae (D). Merged images include DAPI (blue). Scale bar: 3 μm. (E) The average number of Ribeye a punctae per neuromast (white circles) in control (11±2) and ribeye b MO-injected (10±2) larvae, and the average number of Ribeye b punctae (black circles) in control (7±1) and ribeye a MO-injected (9±2) larvae. Each circle represents neuromast 1 in the trunk of an individual larva. Error bars indicate s.e.m. (F) Total pixel intensity (A.U.) of Ribeye a immunolabel in control and ribeye b morphants (Mann-Whitney U-test: P<0.0001), and Ribeye b in control and ribeye a morphants (Mann-Whitney U-test: P=0.80). Whiskers indicate the 10th and 90th percentiles. (G) RT-PCR analysis of control (C) and antisense ribeye b splice site MO-injected whole larvae. cav1.3a was used as a control.
Fig. 3.
Fig. 3.
Morpholino-mediated knockdown of ribeye a and ribeye b in 4-day-old zebrafish larvae. (A-C) Representative confocal z-projections of Ribeye a (red) and Ribeye b (green) immunolabel in neuromast hair cells of wild-type (A), ribeye a morphant (B) and ribeye b morphant larvae (C). Merged images include DAPI (blue). Scale bar: 3 μm. (D) The average number of Ribeye a punctae per neuromast in wild-type (47±4, n=7), control MO-injected (51±7, n=5) and ribeye a (7±4, n=5) or ribeye b (21±3, n=8) antisense MO-injected larvae. Each circle represents neuromast 2 in an individual larva. (E) The average number of Ribeye b punctae per neuromast in wild-type (42±4, n=7), control MO-injected (49±3, n=10), and ribeye a (18±3, n=10) or ribeye b (2±2, n=8) antisense MO-injected larvae. (F) Total pixel intensity (A.U.) of Ribeye a immunolabeled punctae in wild-type and ribeye b morphant larvae, and Ribeye b in control and ribeye a morphants. (Mann-Whitney U-test: P<0.0001 and P<0.003, respectively). (G) The average number of Ribeye a punctae per neuromast in ribeye a and ribeye b control (33±2, n=9) or antisense (12±3, n=8) MO-injected larvae. (H) Total pixel intensity of Ribeye a punctae in control and in a ribeye a and ribeye b morphant (Mann-Whitney U-test; P=0.23). Error bars indicate s.e.m. in D,E,G. Whiskers indicate the 10th and 90th percentiles in F and H.
Fig. 4.
Fig. 4.
ribeye knockdown produces hearing and balance defects in zebrafish larvae. Error bars indicate s.e.m. (A) Acoustic startle response in 4 dpf larvae injected with MOs. Bars represent the percentage of larvae with defective hearing and/or balance. Points within the bars indicate the percentage of larvae with no acoustic startle response. Numbers in parenthesis indicate the number of larvae examined. (B) Vestibular-induced eye movements in ribeye b control (circles) and antisense (squares) MO-injected 3 dpf larvae. Each point represents an individual larva.
Fig. 5.
Fig. 5.
Depletion of Ribeye b results in a reduction in the number of spikes in afferent neurons. (A) Extracellular action currents recorded from a posterior lateral line neuron in response to 20 Hz mechanical stimulation of neuromast hair cells (4 dpf). Shown are overlays of 60 consecutive sweeps from wild-type (black circle) and three ribeye b MO-injected larvae with variable degrees of knockdown (see Results; grey circle, blue circle and red circle). (B) Four frequency histograms (20 Hz) for all spikes recorded in A. Numbers above each histogram indicate the total number of spikes. The overall width and shape of each histogram illustrates that the degree of phase-locking with the stimulus was maintained despite the reduction in spike number. (C) Confocal z-projections of neuromasts from a representative wild-type larva and from the three neuromasts recorded from the ribeye b MO-injected larvae in A. The left panels show Ribeye a staining (red) and the innervating afferent neuron labeled with GFP (green). The right panels show corresponding Ribeye b staining (green). In a larva that was responsive to acoustic stimuli yet displayed a mild balance defect (grey circle), Ribeye b levels were less depleted than the two larvae unresponsive to acoustic stimuli (blue and red circles). Scale bar: 3 μm. Asterisks indicate the tract of the lateral-line nerve. (D) Plot of the relationship between spikes per deflection and the number of Ribeye b punctae. Each circle represents a recorded neuromast from an individual morphant larva, except for the black circle, which represents the average of several wild-type larvae, including that shown in A. The grey, blue and red circles are from the three individual neuromasts in A-C. Error bars indicate s.e.m.
Fig. 6.
Fig. 6.
Depletion of Ribeye results in reduced afferent innervation. (A) Representative confocal z-projections showing GFP-labeled innervating afferent neurons (green), Ribeye a immunolabel (red) and DAPI label (blue) in lateral line neuromast 2 from three individual 4 dpf larva. Scale bars: 3 μm. (B,C) Plots of the relationship between either the total length of innervating afferent processes (B) or the number of afferent branch junctions (C) and the number of Ribeye a immunolabeled punctae in ribeye a and ribeye b morphants. Each point represents neuromast 2 in an individual larva. (D,E) Plot of the relationships between the total length of innervating afferent processes (D) or the number of afferent branch junctions (E) and the number of Ribeye a immunolabeled punctae in wild-type and control MO-injected larvae. There was no significant correlation between dendritic length (Pearson's r=0.4525; P=0.08) or the number of afferent branches (Pearson's r=0.0129; P=0.97) and the number of Ribeye a punctae. The linear regressions of the plots in either B or C are included for comparison (broken red line).
Fig. 7.
Fig. 7.
Localization of the postsynaptic density in ribeye morphants. (A-E) Representative confocal z-projections of pan-MAGUK (green) and Ribeye a (red) immunolabel in posterior lateral line neuromast 2 of 4 dpf larvae. Scale bars: 3 μm (main panels), 1 μm (far right panels). (A,B) MAGUK immunolabel juxtaposes Ribeye-labeled punctae in wild-type (A; n=24) and ribeye b MO-injected larvae (B; n=15). Yellow pixels present in the far right panels indicate the close proximity of Ribeye to MAGUK immunolabel. The brightness of Ribeye a immunolabel in B was increased in the merged panel to better visualize its localization. (C) Ribeye immunolabel was absent in 18% (n=33) of ribeye a and ribeye b MO-injected larvae. (D) MAGUK immunolabel appeared to overlap Ribeye in 49% (n=33) of ribeye a and ribeye b MO-injected larvae. (E) MAGUK immunolabel did not overlap Ribeye in 33% (n=33) of ribeye a and ribeye b MO-injected larvae. Yellow pixels are reduced in the far right panel.
Fig. 8.
Fig. 8.
Ribeye depletion disrupts clustering of presynaptic CaV1.3a channels in hair cells. (A-D) Ribeye b (green) and CaV1.3a (red) immunolabel in cross-sections of anterior lateral line neuromasts at 4 dpf. Merged images include DAPI (blue). Scale bar: 3 μm. (A) CaV1.3a clusters are colocalized with Ribeye b-labeled punctae in control MO-injected larvae. (B) CaV1.3a clusters are absent in ribeye a & b double morphants (50 μM and 750 μM, respectively). (C) CaV1.3a clusters are absent in ribeye b MO-injected (1 mM) larvae. (D) CaV1.3a clusters in ribeye b MO-injected O (500 μM) larvae. CaV1.3a colocalized with the larger Ribeye b punctae in a neuromast with weak Ribeye b knockdown. (E) RT-PCR analysis of tails from 4 dpf larvae injected as in A and B. gapdh was used as a loading control and pcdh15 was used as a hair-cell specific transcript control.
Fig. 9.
Fig. 9.
Stable overexpression of Ribeye b in hair cells. (A,A′) Representative confocal z-projections at the basolateral end (~2.5 μm thick) of hairs cells in neuromast 2. Merged images include Ribeye b-GFP (green), Ribeye b (red) immunolabel and DAPI (blue). Scale bar: 3 μm. (B-E) Representative TEM sections through the ears of 4 dpf wild-type and transgenic larvae with high expression of Ribeye b-GFP. Scale bars: 2 μm in B; 250 nm in C-E. Aff, afferent terminal; N, nucleus; OS, otic space. (B,B′) Representative hair cells from wild-type and transgenic larvae. (C,C′) Representative ribbon synapses. Black arrows indicate attached ribbon synapses adjacent to afferent postsynaptic densities. Black and white arrowhead in C′ indicates an ectopic ribbon body. (D) Ectopic electron-dense aggregates (black and white arrowheads) at the apical end of the hair cell, next to the nucleus. (E) Magnified image of the lower aggregate in D. Red asterisks indicate attached vesicular structures.
Fig. 10.
Fig. 10.
Ectopic aggregates of overexpressed Ribeye colocalize with ectopic clusters of CaV1.3a channel in hair cells. Merged images include DAPI (blue). Scale bars: 3 μm. (A,A′) Ribeye b (green) and CaV1.3a (red) immunolabeling in cross-sections of anterior lateral line neuromasts in 6 dpf larvae. (B) RT-PCR analysis of cav1.3a transcripts in wild-type and transgenic larvae. gapdh was used as a loading control. (C,C′) Ribeye b (green) and MAGUK (red) immunofluorescent labeling in cross-sections of neuromasts. (D) The average number of MAGUK-positive punctae in wild-type and larvae stably expressing high levels of GFP-tagged Ribeye b. Error bars indicate s.e.m.

Similar articles

Cited by

References

    1. Beutner D., Voets T., Neher E., Moser T. (2001). Calcium dependence of exocytosis and endocytosis at the cochlear inner hair cell afferent synapse. Neuron 29, 681-690 - PubMed
    1. Boeckers T. M. (2006). The postsynaptic density. Cell Tissue Res. 326, 409-422 - PubMed
    1. Brandt A., Khimich D., Moser T. (2005). Few CaV1.3 channels regulate the exocytosis of a synaptic vesicle at the hair cell ribbon synapse. J. Neurosci. 25, 11577-11585 - PMC - PubMed
    1. Dick O., tom Dieck S., Altrock W. D., Ammermüller J., Weiler R., Garner C. C., Gundelfinger E. D., Brandstätter J. H. (2003). The presynaptic active zone protein bassoon is essential for photoreceptor ribbon synapse formation in the retina. Neuron 37, 775-786 - PubMed
    1. Emran F., Rihel J., Adolph A. R., Dowling J. E. (2010). Zebrafish larvae lose vision at night. Proc. Natl. Acad. Sci. USA 107, 6034-6039 - PMC - PubMed

Publication types

MeSH terms