. 2012 Feb 1;130(3):532-43.
doi: 10.1002/ijc.26010. Epub 2011 Apr 20.

Akt3 controls vascular endothelial growth factor secretion and angiogenesis in ovarian cancer cells

Affiliations

Akt3 controls vascular endothelial growth factor secretion and angiogenesis in ovarian cancer cells

Tiera A Liby et al. Int J Cancer. .

Abstract

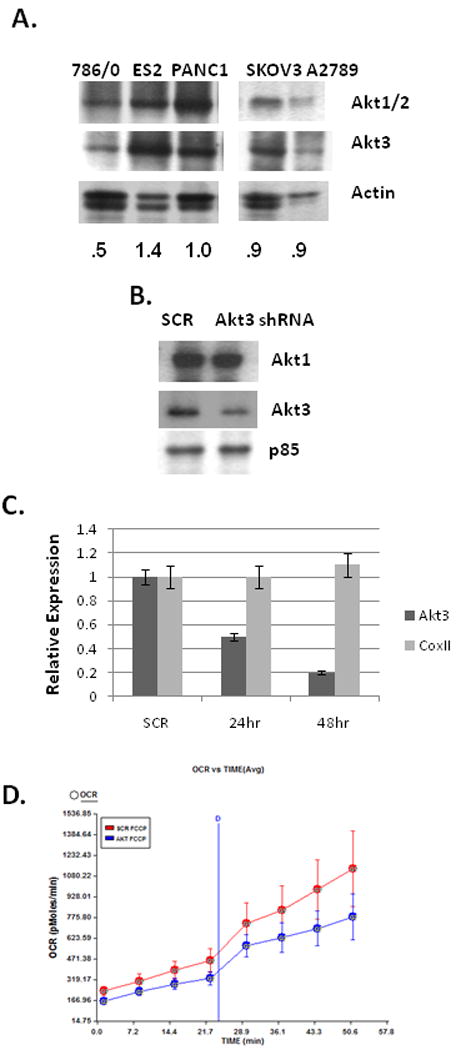
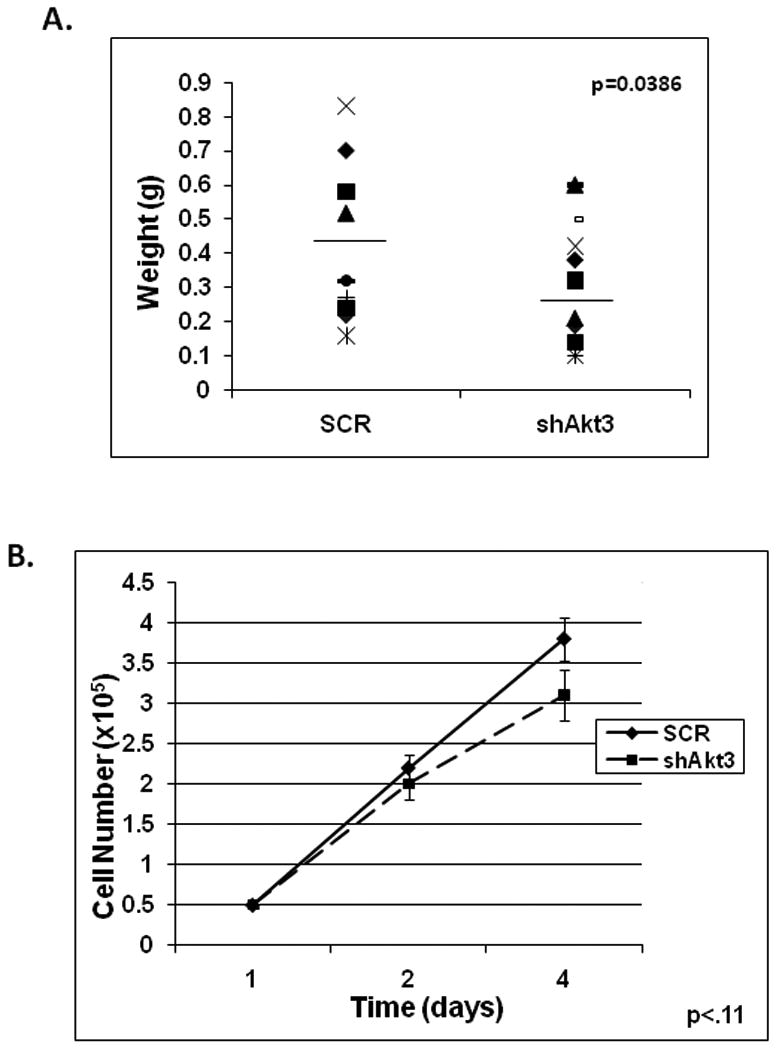
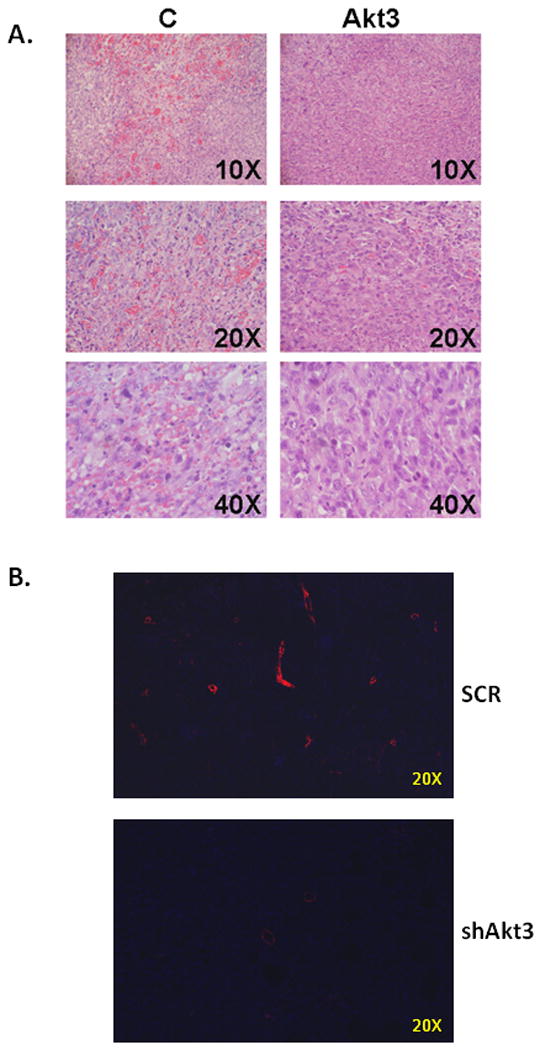
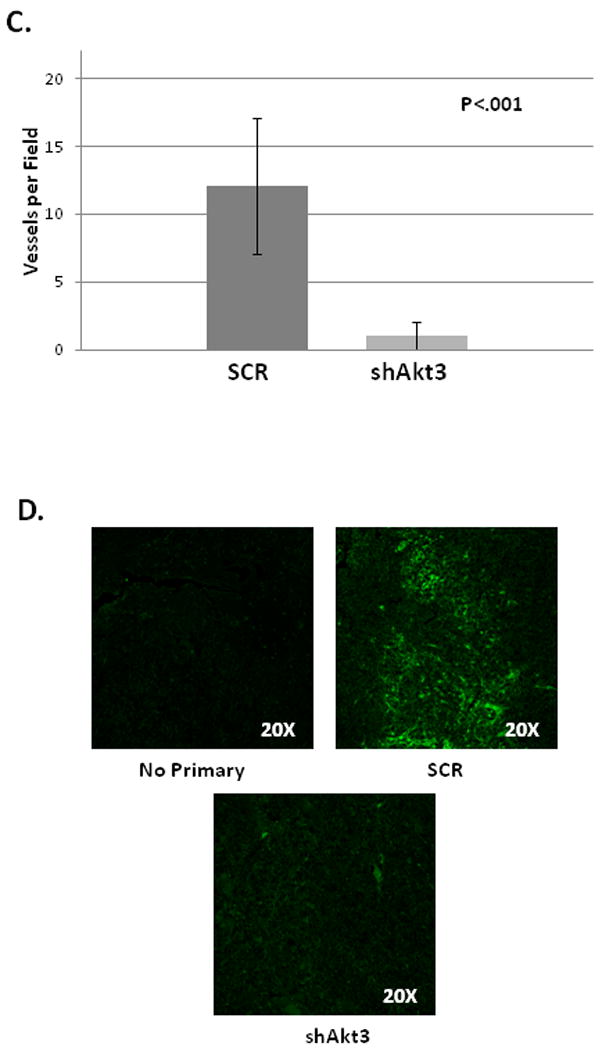
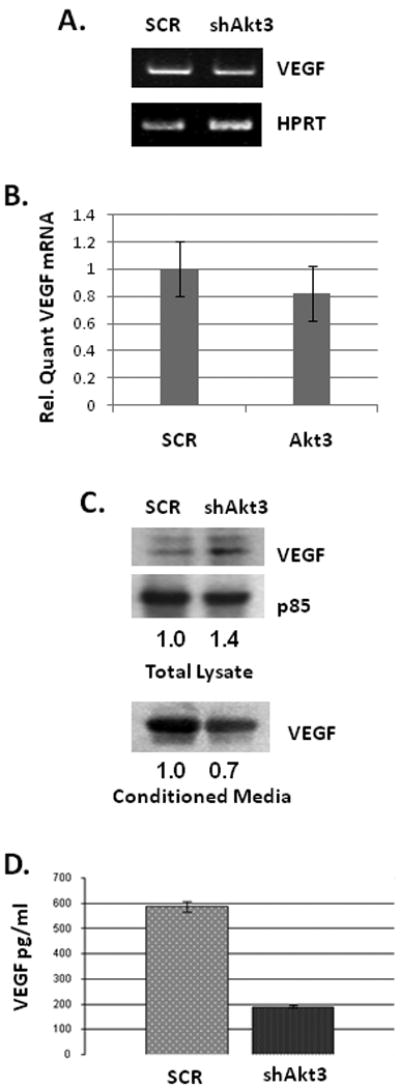
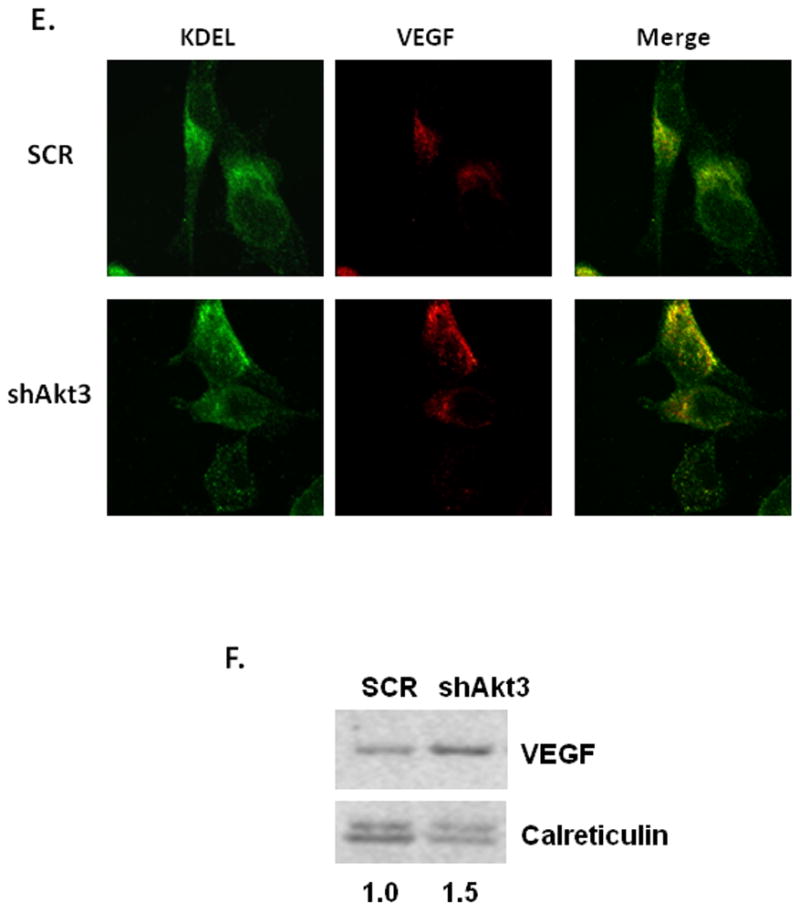
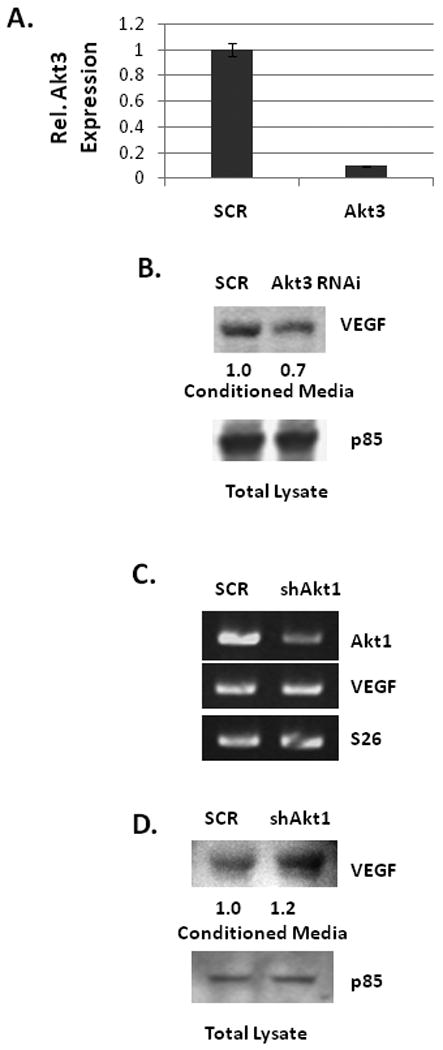
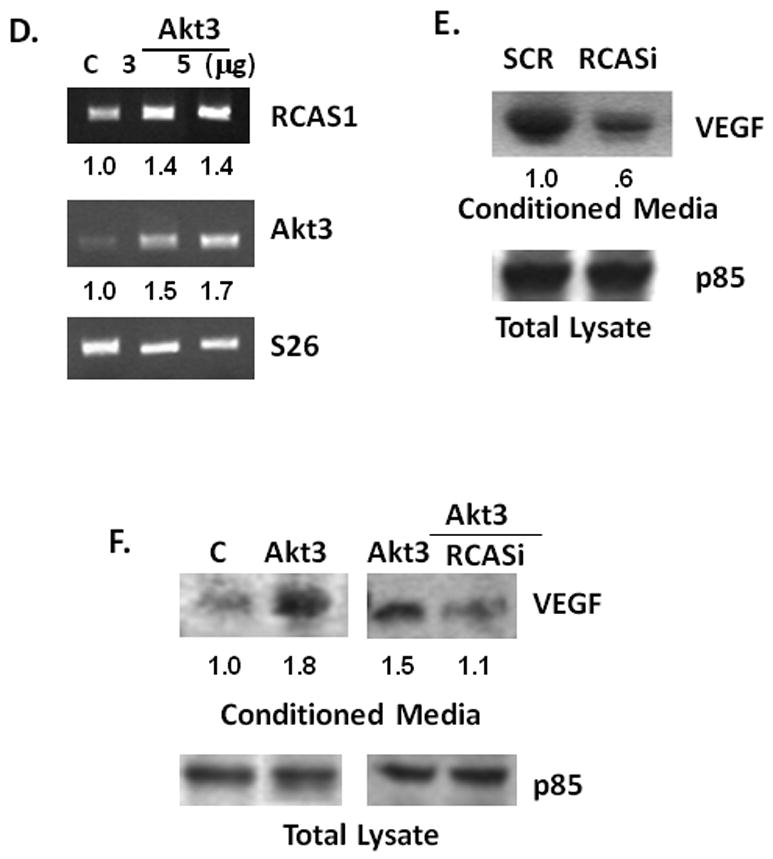
The PI3 kinase/Akt pathway is commonly deregulated in human cancers, functioning in such processes as proliferation, glucose metabolism, survival and motility. We have previously described a novel function for one of the Akt isoforms (Akt3) in primary endothelial cells: the control of VEGF-induced mitochondrial biogenesis. We sought to determine if Akt3 played a similar role in carcinoma cells. Because the PI3 kinase/Akt pathway has been strongly implicated as a key regulator in ovarian carcinoma, we tested the role of Akt3 in this tumor type. Silencing of Akt3 by shRNA did not cause an overt reduction in mitochondrial gene expression in a series of PTEN positive ovarian cancer cells. Rather, we find that blockade of Akt3, results in smaller, less vascularized tumors in a xenograft mouse model that is correlated with a reduction in VEGF expression. We find that blockade of Akt3, but not Akt1, results in a reduction in VEGF secretion and retention of VEGF protein in the endoplasmic reticulum (ER). The reduction in secretion under conditions of Akt3 blockade is, at least in part, due to the down regulation of the resident golgi protein and reported tumor cell marker, RCAS1. Conversely, over-expression of Akt3 results in an increase in RCAS1 expression and in VEGF secretion. Silencing of RCAS1 using siRNA inhibits VEGF secretion. These findings suggest an important role for Akt3 in the regulation of RCAS1 and VEGF secretion in ovarian cancer cells.


Figures

Fig. 1
Fig. 1. Akt3 inhibition does not affect mitochondrial function
(A) Western blot analysis of Akt1/2 and Akt3 in 786/0 (PTEN-) renal carcinoma, and four PTEN positive cell lines ES2, PANC-1, SKOV3 and A2789. Actin is shown as a loading control. Relative ratios of Akt3 expression as compared to actin are shown. (B) Western blot analysis of Akt1 and Akt3 expression in ES2 cells treated with shRNA scrambled control (SCR) or Akt3 shRNA. The p85 PI3 kinase subunit is used as an internal control. (C) Quantitative RT-PCR of total RNA isolated from ES2 cells treated with an shRNA scrambled control (SCR) or Akt3 shRNA for the times indicated using primers directed against Akt3, mitochondrial coxII and HPRT as an internal control. Relative quantities are shown. (D) Graphical representation of O2 consumption rates obtained in real time of ES2 cells transduced with either a scrambled control (SCR) or Akt3 shRNA lentivirus.
Fig. 2
Fig. 2. Blockade of Akt3 expression results in reduced tumor growth in a xenograft mouse model
(A) ES2 cells were stably transduced with either a shRNA scrambled control (SCR) or Akt3 shRNA, injected subcutaneously into SCID mice and allowed to develop for 7 days. Tumors were dissected, fixed and weighed. A graph showing weight of 12 matched tumors are shown. The bar indicates the average weight of each tumor type. (B) Equal numbers of ES2 cells transduced with either a shRNA scrambled control (SCR) or Akt3 shRNA were plated and directly counted for the times indicated. The p value is indicated.
Fig. 3
Fig. 3. Akt3 silencing in tumors results in smaller, less vascularized tumors
(A) H&E staining of paraffin sections within the tumors grown in SCID mice. Different magnifications are shown. (B) Fluorescent images of paraffin sections of tumors derived from cells either expressing scrambled (SCR) or Akt3 shRNA stained using an antibody against α-smooth muscle actin to visualize blood vessels. (C) Quantitation of number of vessels per field of scrambled control (SCR) and shAKT3 expressing tumors. Six fields per section of three independent tumor sections were counted. (D) Fluorescent images of paraffin sections of tumors derived from cells either expressing scrambled (SCR) or Akt3 shRNA stained using an antibody against VEGF. A no primary control is shown using scrambled control sections. Each fluorescent image was obtained using identical parameters.
Fig. 4
Fig. 4. Silencing of Akt3 inhibits VEGF secretion
(A) PCR of total RNA isolated from ES2 cells treated with a shRNA scrambled control (SCR) or Akt3 shRNA (shAkt3) using primers directed against VEGF and HPRT as an internal control. (B) Quantitation of VEGF expression by real time PCR in ES2 cells as treated in A. (C) Western blot analysis of VEGF expression in ES2 cells treated as in A using either total lysate or conditioned media, from the same cells. The PI3K subunit p85 is used as a loading control and relative ratios of VEGF expression is shown. (D) Quantitation of VEGF within conditioned media of cells treated as above performed by ELISA. (E) Visualization of VEGF (red) and KDEL (green) by confocal analyses of ES2 cells treated with scrambled or Akt3 shRNA lentiviruses. Merged images are also shown. (F) Western blot analysis of an ER fraction derived from sucrose gradient centrifugation of either scrambled control (SCR) or Akt3 shRNA transduced cells were assessed for expression of VEGF and the ER marker, Calreticulin. Relative ratios of VEGF expression compared to Calreticulin are shown.
Fig. 5
Fig. 5. Akt1 is not required for VEGF secretion
(A) Real time PCR analysis of total RNA isolated from ES2 cells transiently transfected with an Akt3 RNAi unrelated to the Akt3 shRNA. (B) Western blot analysis of VEGF in conditioned media from cells similarly transfected. Relative ratios of VEGF compared to the internal control are shown. (C) PCR analysis of RNA isolated from ES2 cells treated with a shRNA scrambled control (SCR) or Akt1 shRNA lentivirus using primers directed against Akt1, VEGF and S26 as an internal control. (D) Western blot analysis of VEGF expression in conditioned media from ES2 cells treated as in B. Relative ratios of VEGF compared to the internal control are shown.
Fig. 6
Fig. 6. RCAS1 is localized to the ER and is required for VEGF secretion
(A) Real time PCR analysis of RCAS1 expression in total RNA isolated from ES2 cells transduced with an Akt3 shRNA or scrambled control. Expression is shown relative to S26 as an internal control. (B) Western blot analysis of RCAS1 expression in cells treated either with shAkt3 (top) or with Akt3 RNAi (bottom). Relative ratios are shown. (C) Fluorescent images of ES2 cells stained using antibodies against KDEL (green) and RCAS1 (red) and the resultant merged images. (D) RTPCR of RCAS1 and Akt3 expression in cells transfected with either an empty vector control or two different amounts of an Akt3 expression vector. Relative ratios of both RCAS1 and Akt3 are shown. (D) Western blot analysis of VEGF from conditioned media derived from cells ES2 cells transfected with an RNAi directed against RCAS1 or a scrambled control. p85 is shown as a loading control and relative ratios are shown. (E) Western blot analysis of VEGF in conditioned media from ES2 cells transfected with an Akt3 expression vector with or without co-transfection of an RCAS1 RNAi. p85 is shown as an internal control and relative ratios are shown.

Similar articles

Cited by

References

    1. Bamberger ES, Perrett CW. Angiogenesis in epithelian ovarian cancer. Mol Pathol. 2002;55:348–59. - PMC - PubMed
    1. Kumaran GC, Jayson GC, Clamp AR. Antiangiogenic drugs in ovarian cancer. British journal of cancer. 2009;100:1–7. - PMC - PubMed
    1. Berra E, Milanini J, Richard DE, Le Gall M, Vinals F, Gothie E, Roux D, Pages G, Pouyssegur J. Signaling angiogenesis via p42/p44 MAP kinase and hypoxia. Biochem Pharmacol. 2000;60:1171–8. - PubMed
    1. Pages G, Milanini J, Richard DE, Berra E, Gothie E, Vinals F, Pouyssegur J. Signaling angiogenesis via p42/p44 MAP kinase cascade. Ann N Y Acad Sci. 2000;902:187–200. - PubMed
    1. Semenza GL, Agani F, Feldser D, Iyer N, Kotch L, Laughner E, Yu A. Hypoxia, HIF-1, and the pathophysiology of common human diseases. Advances in experimental medicine and biology. 2000;475:123–30. - PubMed

Publication types

MeSH terms