Review
. 2011 Sep;59(9):1322-40.
doi: 10.1002/glia.21147. Epub 2011 Feb 23.

Physiologic and anatomic characterization of the brain surface glia barrier of Drosophila

Affiliations
Review

Physiologic and anatomic characterization of the brain surface glia barrier of Drosophila

Michael K DeSalvo et al. Glia. 2011 Sep.

Abstract

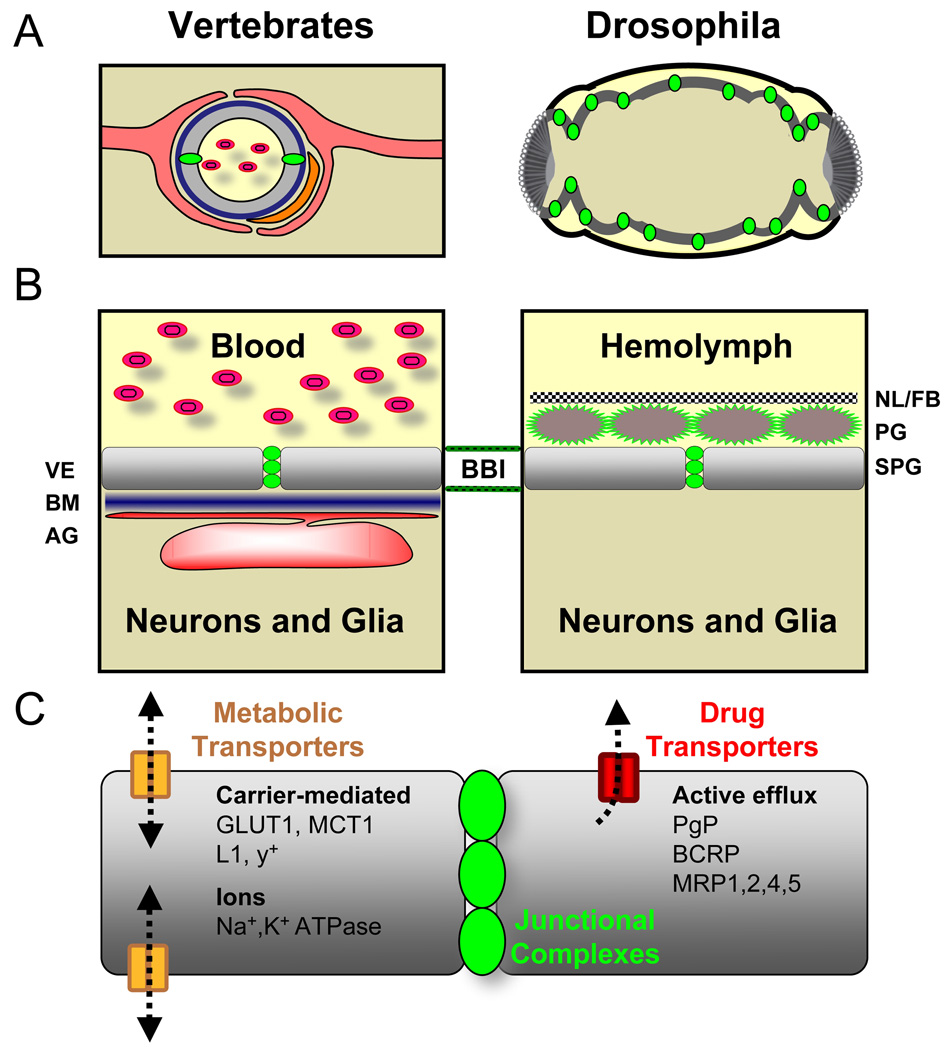
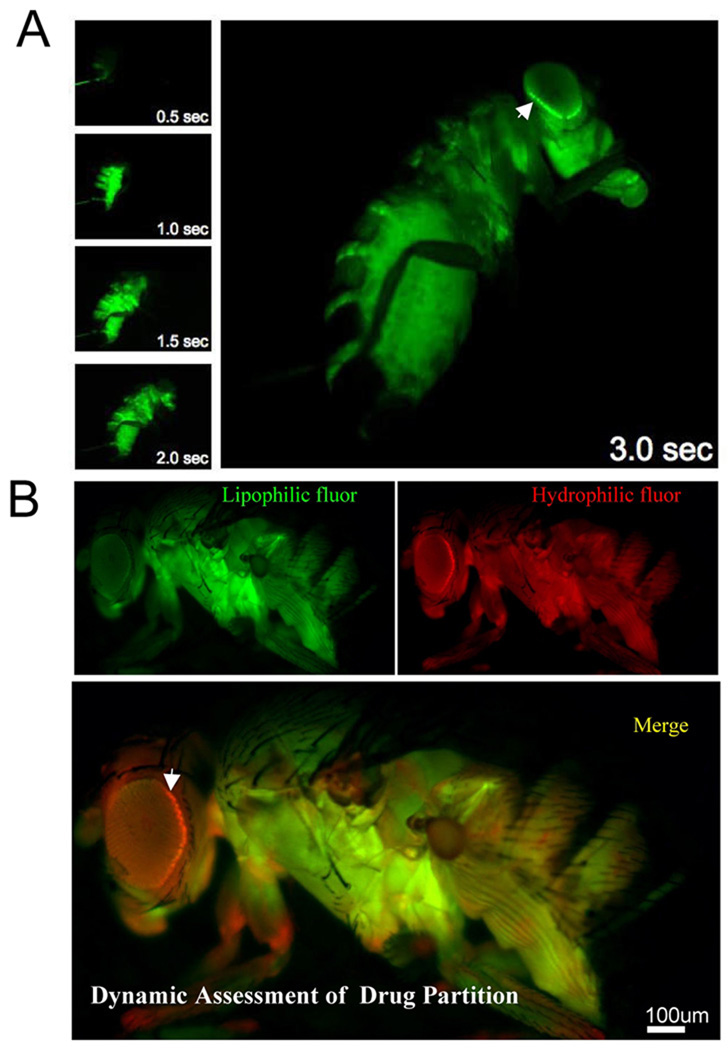
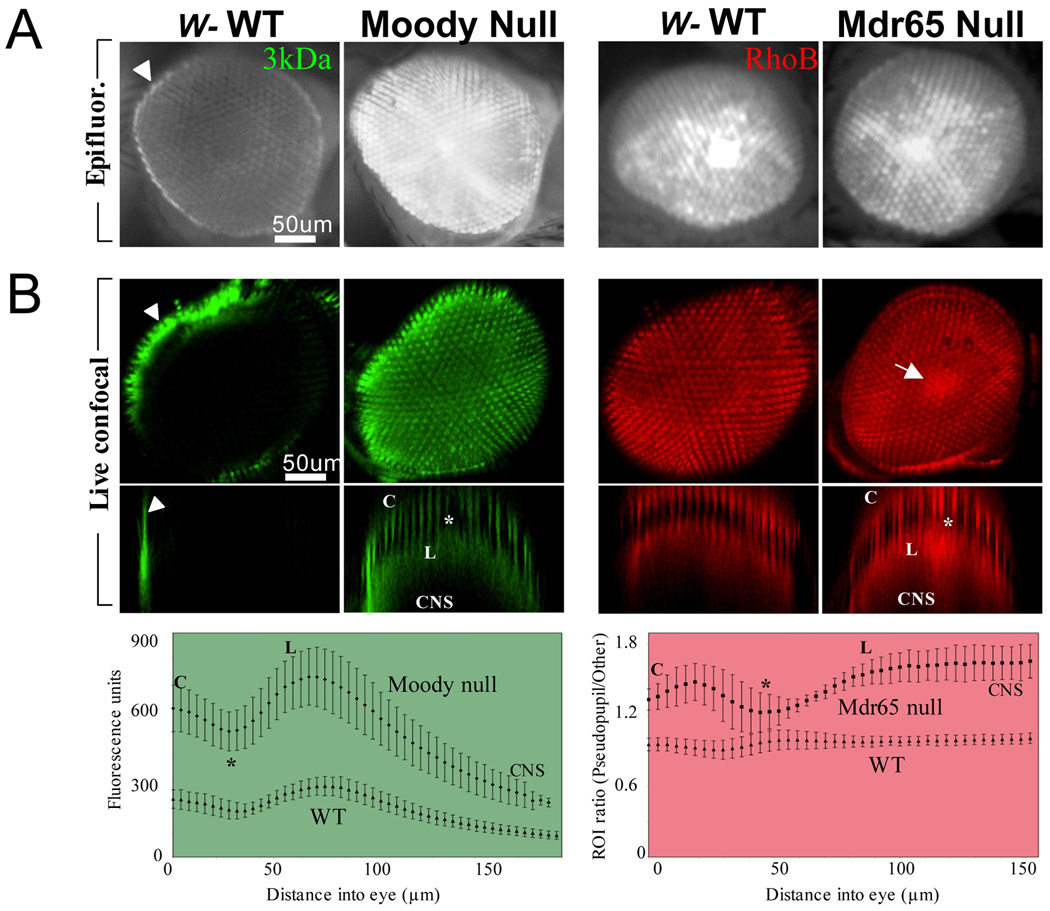
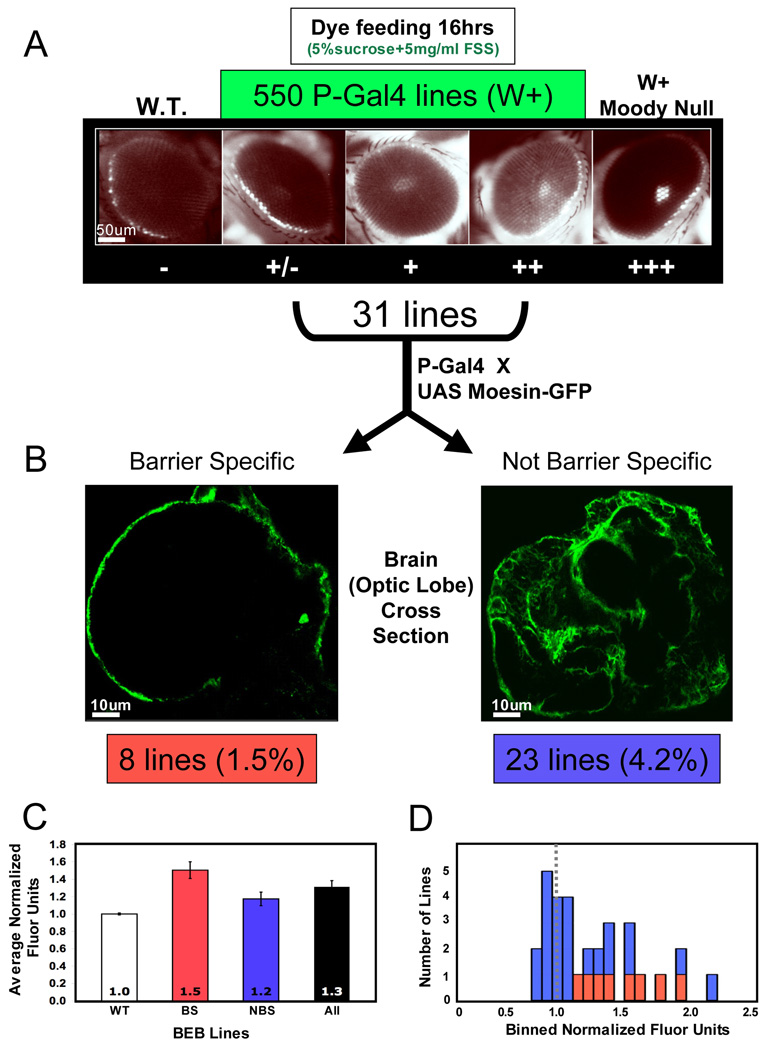
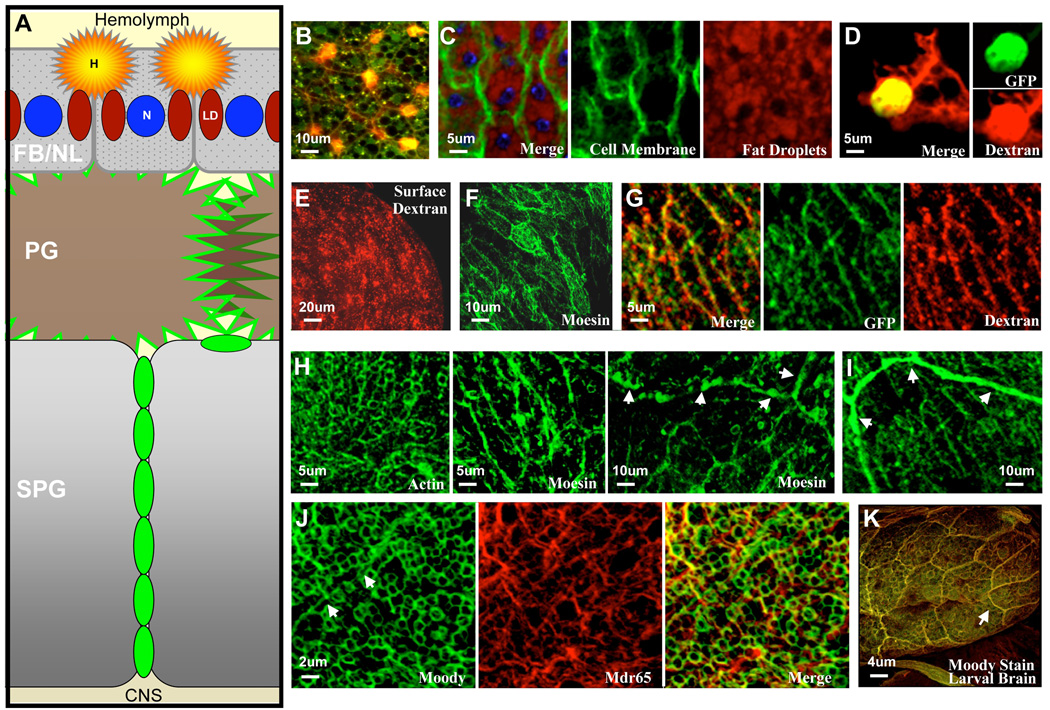
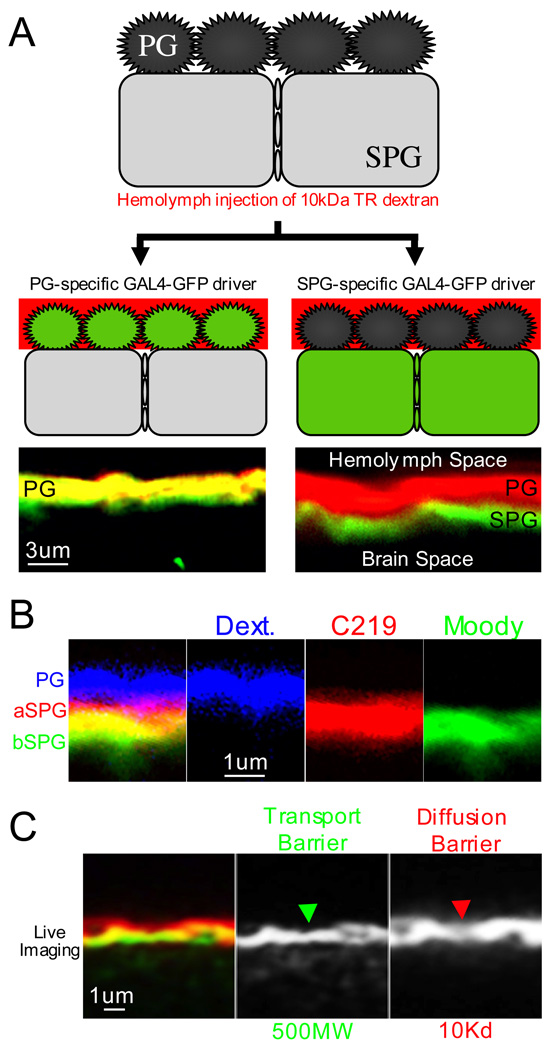
Central nervous system (CNS) physiology requires special chemical, metabolic, and cellular privileges for normal function, and blood-brain barrier (BBB) structures are the anatomic and physiologic constructs that arbitrate communication between the brain and body. In the vertebrate BBB, two primary cell types create CNS exclusion biology, a polarized vascular endothelium (VE), and a tightly associated single layer of astrocytic glia (AG). Examples of direct action by the BBB in CNS disease are constantly expanding, including key pathophysiologic roles in multiple sclerosis, stroke, and cancer. In addition, its role as a pharmacologic treatment obstacle to the brain is long standing; thus, molecular model systems that can parse BBB functions and understand the complex integration of sophisticated cellular anatomy and highly polarized chemical protection physiology are desperately needed. Compound barrier structures that use two primary cell types (i.e., functional bicellularity) are common to other humoral/CNS barrier structures. For example, invertebrates use two cell layers of glia, perineurial and subperineurial, to control chemical access to the brain, and analogous glial layers, fenestrated and pseudocartridge, to maintain the blood-eye barrier. In this article, we summarize our current understanding of brain-barrier glial anatomy in Drosophila, demonstrate the power of live imaging as a screening methodology for identifying physiologic characteristics of BBB glia, and compare the physiologies of Drosophila barrier layers to the VE/AG interface of vertebrates. We conclude that many unique BBB physiologies are conserved across phyla and suggest new methods for modeling CNS physiology and disease.


Figures

Figure 1
Figure 1. Blood-brain barrier anatomy in vertebrates and flies
(A) The vertebrate barrier (left) consists of the vascular endothelium (VE, grey), which possess tight junctions (green). The basement membrane (BM, blue) immediately surrounds the endothelium, which itself is surrounded the endfeet processes of astrocytic glia (AG, red). Pericytes (orange) are modulatory cells interspersed between the AG and VE. This compound barrier structure isolates the central nervous system (beige) from the blood (yellow, containing red blood cells). The Drosophila barrier (right) is oriented differently; the brain (beige) is surrounded by hemolymph (yellow), and a single epithelial layer, the subperineurial glia (SPG, grey), forms the passive diffusion barrier by utilizing chemically tight septate junction complexes (green). (B) On the left is a schematic representation of humoral to CNS (apical to basal) components of the vertebrate BBB. In order to enter the CNS, a substance must pass the VE (colors are the same as in A), the BM, and a closely opposed AG layer to reach neurons. On the right is a proposed barrier layer model for the Drosophila BBB. In this case a substance must pass the neural lamella and fat body layer (NL/FB, checkered line), perineurial glia (PG, maroon), and SPG to reach the CNS. (C) Numerous essential transport systems are active at the chemical protection interfaces of the VE. Shown here are vertebrate VE transporters, which include metabolic transporters that operate in both directions via carrier-mediated transport, and drug transporters that mainly efflux xenobiotics away from the CNS.
Figure 2
Figure 2. Examples of live whole animal dye injection and chemical partition in the hemolymph compartment
(A) A series of images taken on a fluorescent dissecting microscope during a live injection of 3kDa FITC dextran. Note the rapid delivery of hemolymph around the entire animal and specific hemolymph partition at the retina/cuticle interface (arrow). (B) Simultaneous assessment of transport and diffusion barriers by hemolymph co-injection of Rhodamine 123 and 10kDa Texas Red dextran. Images are taken live under CO2 anesthesia 15 min post injection using green and red filter sets, respectively. Hemolymph exclusion from the CNS is seen as a bright line around the retina, referred to as the hemolymph exclusion line (arrow).
Figure 3
Figure 3. Methods for studying barrier physiology in Drosophila
Imaging through white−/− eyes allows for visualization and quantification of chemical fluor into the fly brain. (A) Rapid Retinal Epifluorescence Assay. On the left are retinas of wild type and Moody null (diffusion barrier defective) adult flies injected with 3kDa FITC dextran and imaged 4hr post-injection. In all panels, the arrowhead points to the hemolymph exclusion line (HEL). On the right are retinas of wild type and Mdr65 null (transport barrier defective) adult flies injected with Rhodamine B and imaged 4hr post-injection. (B) Live Confocal Microscopy Assay. Retinal images are taken in 4µm intervals through the fly head and digital 3D reconstructions are made based on fluorescence signal intensities (Top). The same data is reconstructed in a cross-sectional pixel intensity map from the anatomic center of the eye (Middle). Fluorescence intensities of regions of interest within the retinas (n=5 per genotype) plotted along the Z-axis (Bottom). On the left, confocal imaging recapitulates the diffusion barrier phenotype of Moody null flies seen with epifluorescence. On the right, the transport barrier phenotype of the Mdr65 null is now readily apparent. Note that the quantitation demonstrates better phenotypic differences at deeper depths that correspond to the central brain (see Methods). The arrow points to the pseudopupil, the group of adjacent ommatidia that are in line with the visual axis of the observer. The labels on the 2D cross-sections of mutants correspond with the labels on the bottom panels. C = cornea, * = retina, L = lamina, and CNS = central nervous system.
Figure 4
Figure 4. Overview of the screening methodology
(A) 550 P-GAL4 lines were fed overnight with fluorescein sodium salt (FSS) in 5% sucrose. Flies were viewed on a fluorescent dissecting microscope, and a retinal dye penetration phenotype was scored qualitatively with white+/+ (W+) wild type animals as a negative control (far left) and a W+ version of the Moody null as a positive control (far right). Sample screen lines are shown in between. Thirty-one lines with + or ++ phenotypes were kept for retesting and further analysis. (B) All putative BBB-defective P-GAL4 strains were crossed to UAS-Moesin-GFP to localize gene expression in larval brains. The eight lines displaying gene expression peripheral to the brain were designated as BBB-specific (left); the remaining 23 lines displayed broad gene expression patterns often including the central nervous system (right). (C) All 31 lines were also subjected to rigorous injection-dissection assays with 3kDa dextran to confirm diffusion barrier defects. The eight BBB-specific lines (BS) had 1.5-fold greater brain fluorescence relative to controls compared to 1.2-fold for the 23 non-BBB-specific lines (NBS). Averages for the BS and NBS lines were significantly different than the controls (one sample t-tests, BS p < 0.01, NBS p < 0.05) and significantly different from each other (two sample t-test, p < 0.05). (D) A frequency histogram of normalized brain fluorescence of NBS (blue) and BS (red) lines reveals that the majority of NBS lines had values equal to controls, but two outliers show marked dye penetration. Note that all BS lines were greater than WT controls.
Figure 5
Figure 5. Screen Summaries and Surface Anatomy
(A) Genes that modify BBB function are found in multiple cellular layers depicted in a cartoon image (not drawn to scale). FB/NL= fat body neural lamella, N=nucleus, LD=lipid droplets, PG=perineurial glia, and SPG=subperineurial glia. Gene expression patterns of the Drosophila humoral interface were assayed in several ways. Brain surface images were obtained by crossing the P-GAL4 to various GFP markers, and adult brains were fixed in situ and then mounted with the posterior medulla shown in the X-Y plane (in our hands the posterior medulla is best preserved for obtaining surface morphology). (B) In this image the posterior medulla is covered by a fat body and histiocytes best seen by hemolymph co-injection of 3kDa FITC dextran and 2000kDa TMR dextran in a wild type animal. Both dextrans are taken up by histiocytes (yellow) while the 3kDa FITC penetrates the FB to the PG layer. (C) A fat body specific driver and putative BBB modulator, 11–165 GAL4, is crossed to CD8 GFP (membrane bound GFP). GFP outlines the cell bodies (green), co-stained with Nile Red, a neutral lipid localizing dye (red) and DAPI (blue). Individual green and red channels are shown to the right. (D) Hemolectin-GAL4 crossed to soluble GFP confirms that dextran-accumulating cells (red) in the fat body are of hemocyte origin (Irving et al. 2005). (E) Lysine-fixable 10kDa Texas Red dextran accumulating on the surface of PG cells (in the absence of a fat body) marks the brain surface in a uniform grainy pattern. (F) A PG specific line, 10–72 GAL4, is crossed to Moesin-GFP (a membrane-organizing extension spike protein that is a cross linker between the actin cytoskeleton and the plasma membrane). GFP marks the PG cells in a striated pattern with a uniform periodicity on the brain surface. (G) A similar striated pattern is shown in Nrg-GFP (green). Interestingly 10kDa dextran accumulates in the same pattern at PG cell borders (green and red merge). (H) Moody enhancer SPG-GAL4 crossed to different cytoskeletal GFP reporters marks the SPG cells and reveals SPG morphology. These reagents are helpful to recognize the SPG morphology. SPG-GAL4 crossed to actin-GFP (the monomeric subunit of two types of filaments in cells) marks all cells that express Moody in the SPG layer. Note actin-GFP does not mark pleated septate junctions, but maintains a pattern similar to Moody staining (see J). SPG-GAL4 crossed to Moesin-GFP produces two distinct cytoskeletal patterns. Pleated septate junctions are well marked, but appear discontinuous (Moesin, left) and a prominent striated pattern is also seen of similar periodicity to the PG layer (Moesin, right). (I) Nrg-GFP demonstrates very high contrast signal at the pleated septate junctions in the adult fly brain. (J) Moody beta antibody marks the basal membrane of the SPG layer (Mayer et al. 2009) demonstrating a prominent circular pattern molding to neuronal cell bodies below. Moody does not distinctly mark homotypic septate junctions in adult animals, but can be found at cell edges upon close inspection (arrows). C219, an Mdr65 transporter antibody, shows the apical membrane cell morphology of the SPG layer. A merged image demonstrates no co-localization of the two antibodies in the SPG layer (also see Fig. 6B). (K) Co-staining of the larval ventral nerve cord of the two forms of the Moody GPCR with alpha Moody and beta Moody antibody (Green Moody beta, red Moody alpha). The two antibodies show exact co-localization and demonstrate prominent septate junction localization. Similar prominent SJ localization can be found in the adult brain in BBB mutants (data not shown).
Figure 6
Figure 6. High resolution confocal microscopy of the physiologic barrier
(A) Following crosses between BBB-specific P-GAL4 lines and UAS-GFP, progeny were injected with 10kDa red dextran. Two main GAL4 expression patterns emerged: 1) on the left, an example of a PG expressing line in which GFP expression overlaps with dextran signal; 2) on the right, an example of an SPG expressing line in which GFP and dextran fluorescence show little signal overlap. (B) With antibodies to Moody and Mdr65, apical and basal expression of proteins expressed in the SPG can be discerned. In this example, the PG layer is labeled by 3kDa cascade blue dextran, the apical SPG membrane by Mdr65 antibody (C219, red), and the basal SPG membrane by Moody beta antibody (green). (C) A co-injection of dextran and small molecule fluors and subsequent live confocal microscopy allows simultaneous live visualization of the chemical transport barrier (TB) and the diffusion barrier (DB) in a wild type animal. The TB is demarcated by the accumulation of BODIPY-labeled Prazocin (green), a transportable substrate. The DB is delineated by the accumulation of 10kDa red dextran.

References

    1. Abbott NJ. Prediction of blood-brain barrier permeation in drug discovery from in vivo, in vitro and in silico models. Drug Discovery Today: Technologies. 2004;1(4):407–416. - PubMed
    1. Abbott NJ. Dynamics of CNS barriers: evolution, differentiation, and modulation. Cell Mol Neurobiol. 2005;25(1):5–23. - PMC - PubMed
    1. Abbott NJ, Ronnback L, Hansson E. Astrocyte-endothelial interactions at the blood-brain barrier. Nat Rev Neurosci. 2006;7(1):41–53. - PubMed
    1. Alvarez JI, Cayrol R, Prat A. Disruption of central nervous system barriers in multiple sclerosis. Biochim Biophys Acta. 2010 - PubMed
    1. Anderson CM, Nedergaard M. Astrocyte-mediated control of cerebral microcirculation. Trends Neurosci. 2003;26(7):340–344. author reply 344-5. - PubMed

Publication types

MeSH terms

LinkOut - more resources