

Probing intracellular biomarkers and mediators of cell activation using nanosensors and bioorthogonal chemistry
- PMID: 21351804
- PMCID: PMC3088084
- DOI: 10.1021/nn200333m
Probing intracellular biomarkers and mediators of cell activation using nanosensors and bioorthogonal chemistry
Abstract
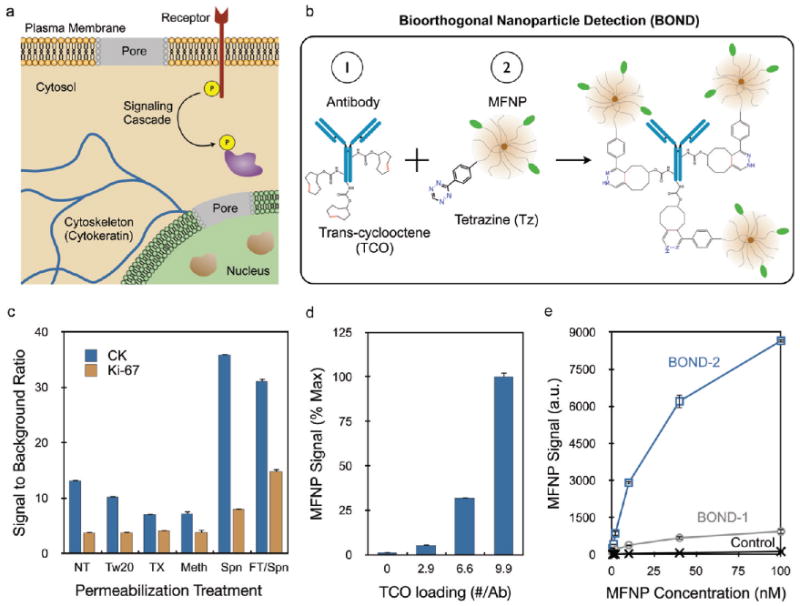
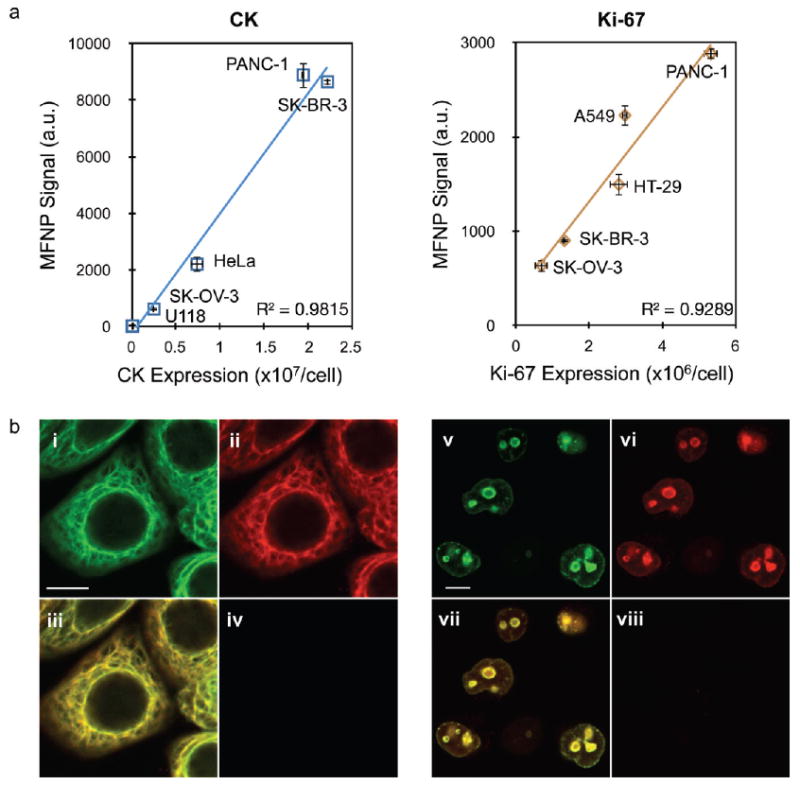
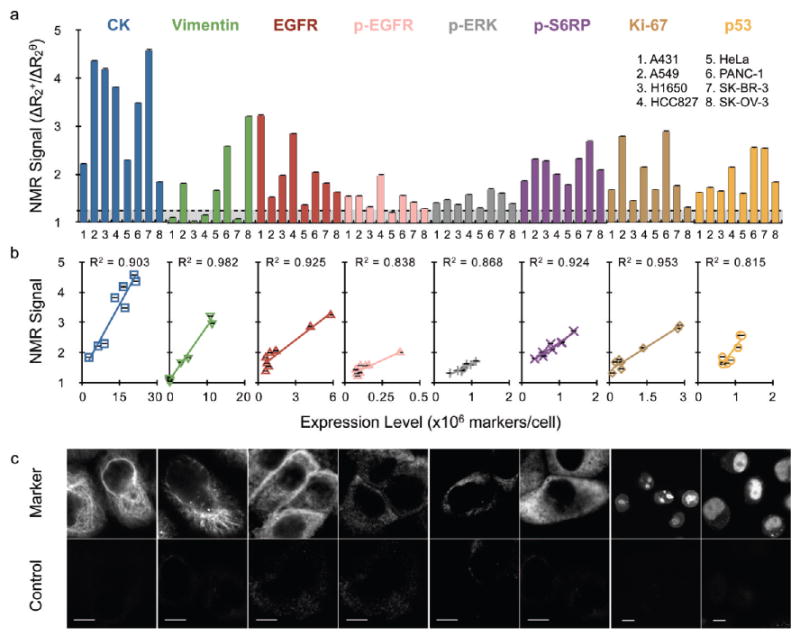
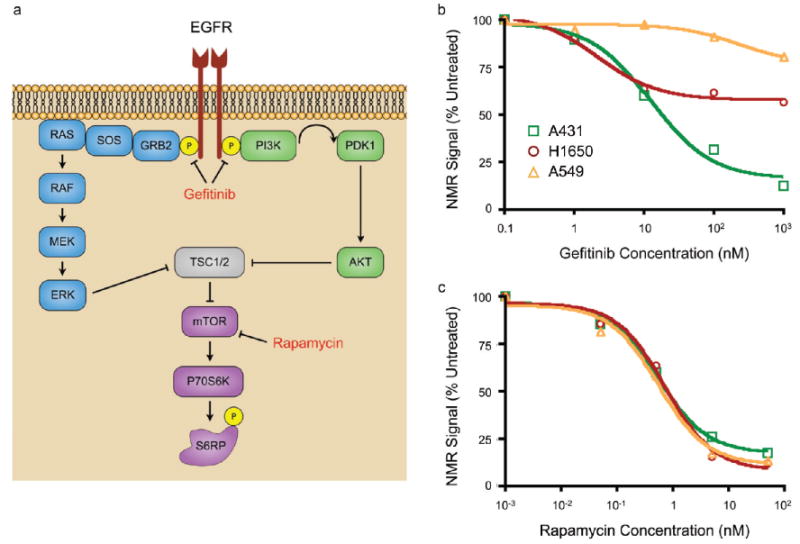
Nanomaterials offer unique physical properties that make them ideal biosensors for scant cell populations. However, specific targeting of nanoparticles to intracellular proteins has been challenging. Here, we describe a technique to improve intracellular biomarker sensing using nanoparticles that is based on bioorthogonal chemistry. Using trans-cyclooctene-modified affinity ligands that are administered to semipermeabilized cells and revealed by cycloaddition reaction with tetrazine-conjugated nanoparticles, we demonstrate site-specific amplification of nanomaterial binding. We also show that this technique is capable of sensing protein biomarkers and phosho-protein signal mediators, both within the cytosol and nucleus, via magnetic or fluorescent modalities. We expect the described method will have broad applications in nanomaterial-based diagnostics and therapeutics.
Figures
Similar articles
-
Bioorthogonal chemistry amplifies nanoparticle binding and enhances the sensitivity of cell detection.Nat Nanotechnol. 2010 Sep;5(9):660-5. doi: 10.1038/nnano.2010.148. Epub 2010 Aug 1. Nat Nanotechnol. 2010. PMID: 20676091 Free PMC article.
-
Biomedical applications of tetrazine cycloadditions.Acc Chem Res. 2011 Sep 20;44(9):816-27. doi: 10.1021/ar200037t. Epub 2011 May 31. Acc Chem Res. 2011. PMID: 21627112 Free PMC article.
-
Orthogonal amplification of nanoparticles for improved diagnostic sensing.ACS Nano. 2012 Apr 24;6(4):3506-13. doi: 10.1021/nn300536y. Epub 2012 Mar 23. ACS Nano. 2012. PMID: 22424443 Free PMC article.
-
Dextran-coated iron oxide nanoparticles: a versatile platform for targeted molecular imaging, molecular diagnostics, and therapy.Acc Chem Res. 2011 Oct 18;44(10):842-52. doi: 10.1021/ar200084x. Epub 2011 Jun 10. Acc Chem Res. 2011. PMID: 21661727 Free PMC article. Review.
-
Tetrazine-trans-cyclooctene ligation: Unveiling the chemistry and applications within the human body.Bioorg Chem. 2024 Sep;150:107573. doi: 10.1016/j.bioorg.2024.107573. Epub 2024 Jun 18. Bioorg Chem. 2024. PMID: 38905885 Review.
Cited by
-
Nanoparticles and bioorthogonal chemistry joining forces for improved biomedical applications.Nanoscale Adv. 2021 Jan 21;3(5):1261-1292. doi: 10.1039/d0na00873g. eCollection 2021 Mar 9. Nanoscale Adv. 2021. PMID: 36132873 Free PMC article. Review.
-
Bioimaging Probes Based on Magneto-Fluorescent Nanoparticles.Pharmaceutics. 2023 Feb 17;15(2):686. doi: 10.3390/pharmaceutics15020686. Pharmaceutics. 2023. PMID: 36840008 Free PMC article. Review.
-
Multimodal iron oxide nanoparticles for hybrid biomedical imaging.NMR Biomed. 2013 Jul;26(7):756-65. doi: 10.1002/nbm.2872. Epub 2012 Oct 15. NMR Biomed. 2013. PMID: 23065771 Free PMC article. Review.
-
Magnetic nanoparticles in magnetic resonance imaging and diagnostics.Pharm Res. 2012 May;29(5):1165-79. doi: 10.1007/s11095-012-0711-y. Epub 2012 Mar 6. Pharm Res. 2012. PMID: 22392330 Review.
-
Recent Developments in Magnetic Diagnostic Systems.Chem Rev. 2015 Oct 14;115(19):10690-724. doi: 10.1021/cr500698d. Epub 2015 Aug 10. Chem Rev. 2015. PMID: 26258867 Free PMC article. Review. No abstract available.
References
-
- Spiller DG, Wood CD, Rand DA, White MR. Measurement of Single-Cell Dynamics. Nature. 2010;465:736–745. - PubMed
-
- Hood L, Heath JR, Phelps ME, Lin B. Systems Biology and New Technologies Enable Predictive and Preventative Medicine. Science. 2004;306:640–643. - PubMed
-
- Dowsett M, Dunbier AK. Emerging Biomarkers and New Understanding of Traditional Markers in Personalized Therapy for Breast Cancer. Clin Cancer Res. 2008;14:8019–8026. - PubMed
-
- Haun JB, Yoon TJ, Lee H, Weissleder R. Magnetic Nanoparticle Biosensors. Wiley Interdiscip Rev Nanomed Nanobiotechnol. 2010;2:291–304. - PubMed
Publication types
MeSH terms
Substances
Grants and funding
- K01 EB010078/EB/NIBIB NIH HHS/United States
- P50 CA086355/CA/NCI NIH HHS/United States
- R01 EB010011/EB/NIBIB NIH HHS/United States
- K01EB010078/EB/NIBIB NIH HHS/United States
- F32CA144139/CA/NCI NIH HHS/United States
- R01 EB004626/EB/NIBIB NIH HHS/United States
- R01 EB 010011/EB/NIBIB NIH HHS/United States
- U54 CA151884/CA/NCI NIH HHS/United States
- F32 CA144139/CA/NCI NIH HHS/United States
- HHSN268201000044C/HL/NHLBI NIH HHS/United States
- R01 EB 004626/EB/NIBIB NIH HHS/United States
- U54 CA 151884/CA/NCI NIH HHS/United States
- U54 11934/PHS HHS/United States
LinkOut - more resources
Full Text Sources
Other Literature Sources
