

Isolation and characterization of node/notochord-like cells from mouse embryonic stem cells
- PMID: 21351873
- PMCID: PMC3928718
- DOI: 10.1089/scd.2011.0042
Isolation and characterization of node/notochord-like cells from mouse embryonic stem cells
Abstract
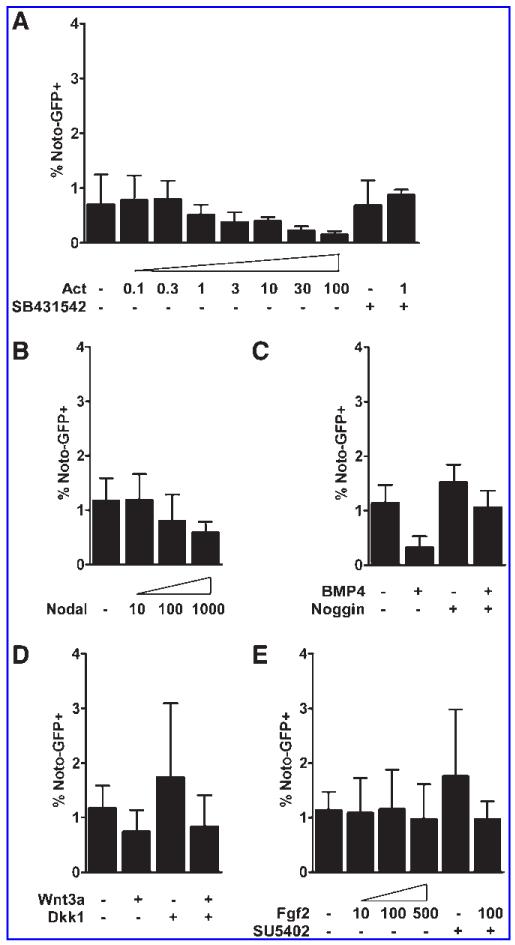
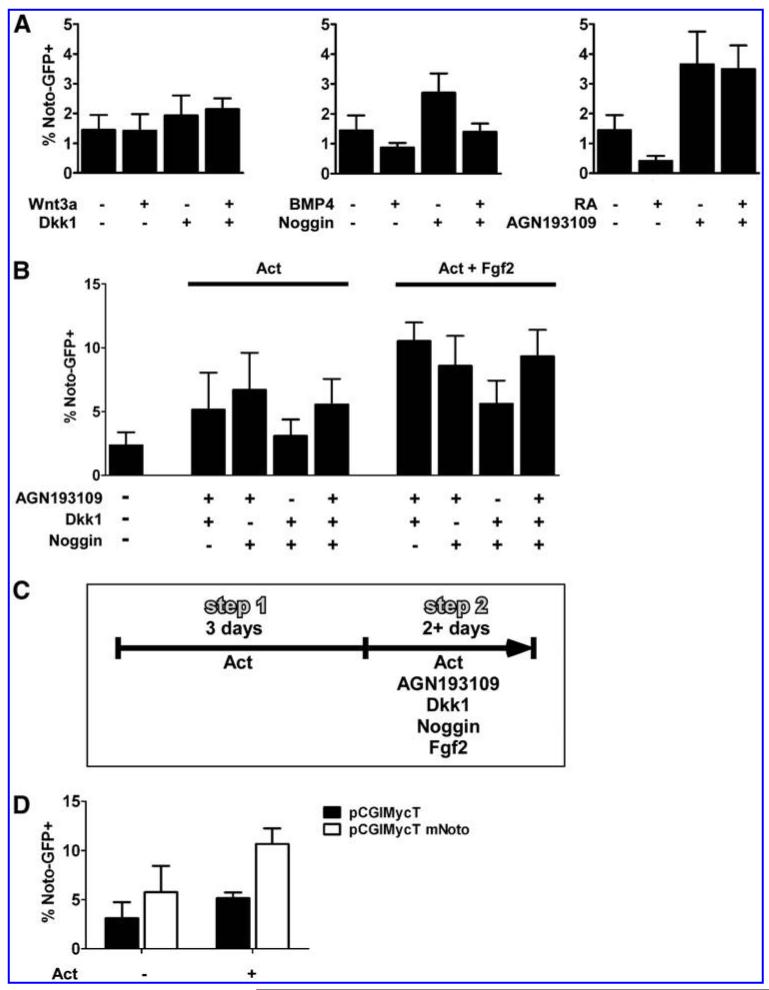
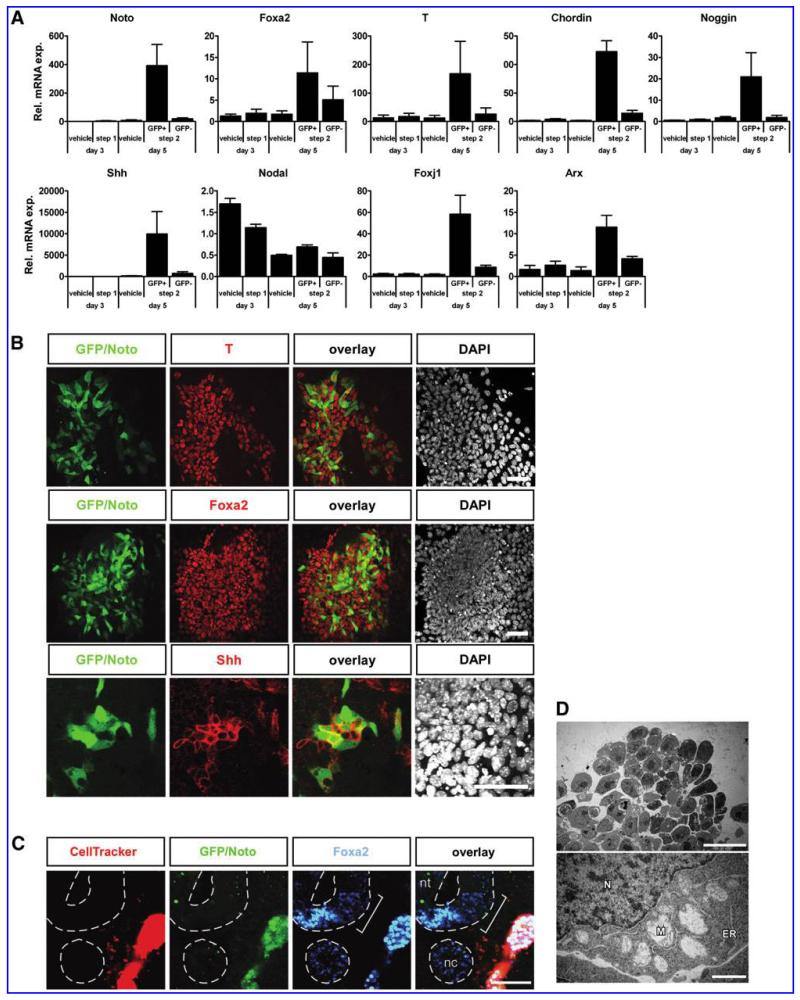
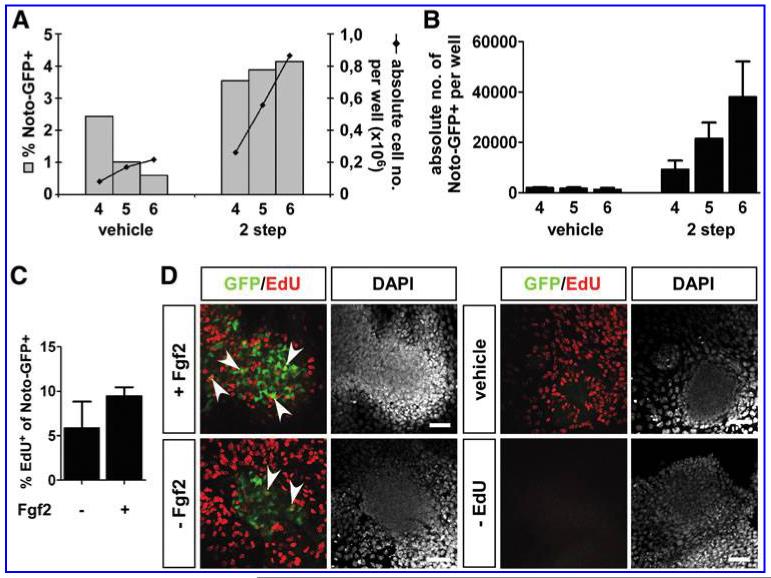
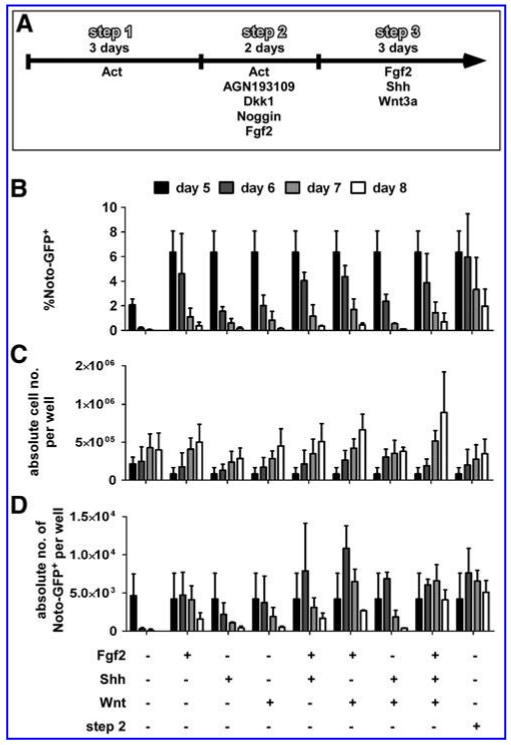
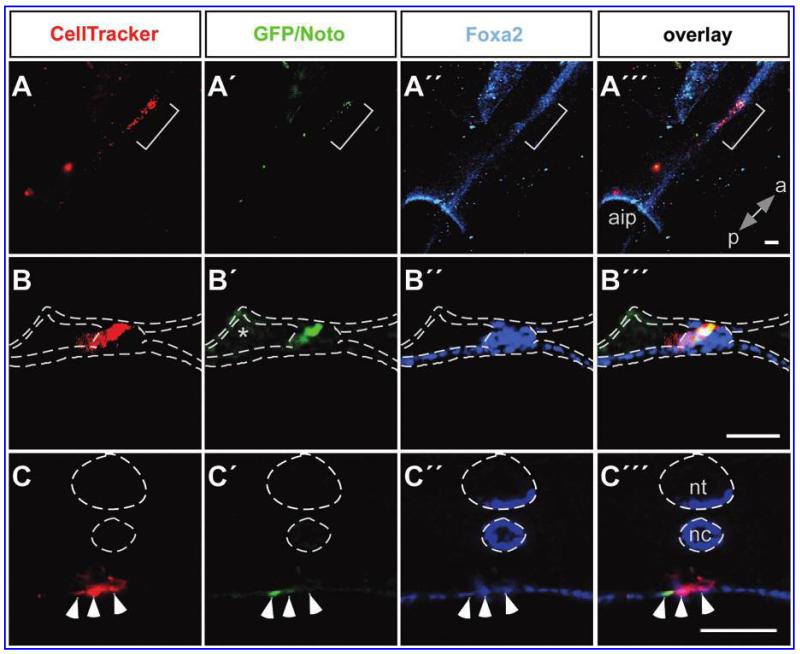
The homeobox gene Noto is expressed in the node and its derivative the notochord. Here we use a targeted Noto-GFP reporter to isolate and characterize node/notochord-like cells derived from mouse embryonic stem cells. We find very few Noto-expressing cells after spontaneous differentiation. However, the number of Noto-expressing cells was increased when using Activin A to induce a Foxa2- and Brachyury-expressing progenitor population, whose further differentiation into Noto-expressing cells was improved by simultaneous inhibition of BMP, Wnt, and retinoic acid signaling. Noto-GFP(+) cells expressed the node/notochord markers Noto, Foxa2, Shh, Noggin, Chordin, Foxj1, and Brachyury; showed a vacuolarization characteristic of notochord cells; and can integrate into midline structures when grafted into Hensen's node of gastrulating chicken embryos. The ability to generate node/notochord-like cells in vitro will aid the biochemical characterization of these developmentally important structures.
Figures
Similar articles
-
A novel mammal-specific three partite enhancer element regulates node and notochord-specific Noto expression.PLoS One. 2012;7(10):e47785. doi: 10.1371/journal.pone.0047785. Epub 2012 Oct 22. PLoS One. 2012. PMID: 23110100 Free PMC article.
-
Defining subregions of Hensen's node essential for caudalward movement, midline development and cell survival.Development. 1999 Nov;126(21):4771-83. doi: 10.1242/dev.126.21.4771. Development. 1999. PMID: 10518494
-
Notch signalling regulates the contribution of progenitor cells from the chick Hensen's node to the floor plate and notochord.Development. 2010 Feb;137(4):561-8. doi: 10.1242/dev.041608. Development. 2010. PMID: 20110321 Free PMC article.
-
Organizers in Development.Curr Top Dev Biol. 2016;117:435-54. doi: 10.1016/bs.ctdb.2015.11.023. Epub 2016 Feb 12. Curr Top Dev Biol. 2016. PMID: 26969994 Review.
-
Grafting Hensen's node.Methods Mol Biol. 2008;461:265-76. doi: 10.1007/978-1-60327-483-8_18. Methods Mol Biol. 2008. PMID: 19030803 Review. No abstract available.
Cited by
-
Timely TGFβ signalling inhibition induces notochord.Nature. 2025 Jan;637(8046):673-682. doi: 10.1038/s41586-024-08332-w. Epub 2024 Dec 18. Nature. 2025. PMID: 39695233 Free PMC article.
-
Biomaterials and Cell-Based Regenerative Therapies for Intervertebral Disc Degeneration with a Focus on Biological and Biomechanical Functional Repair: Targeting Treatments for Disc Herniation.Cells. 2022 Feb 9;11(4):602. doi: 10.3390/cells11040602. Cells. 2022. PMID: 35203253 Free PMC article. Review.
-
Brachyury and SMAD signalling collaboratively orchestrate distinct mesoderm and endoderm gene regulatory networks in differentiating human embryonic stem cells.Development. 2015 Jun 15;142(12):2121-35. doi: 10.1242/dev.117838. Epub 2015 May 26. Development. 2015. PMID: 26015544 Free PMC article.
-
In vitro and in vivo models define a molecular signature reference for human embryonic notochordal cells.iScience. 2024 Jan 26;27(2):109018. doi: 10.1016/j.isci.2024.109018. eCollection 2024 Feb 16. iScience. 2024. PMID: 38357665 Free PMC article.
-
A Multiplexed Barcodelet Single-Cell RNA-Seq Approach Elucidates Combinatorial Signaling Pathways that Drive ESC Differentiation.Cell Stem Cell. 2020 Jun 4;26(6):938-950.e6. doi: 10.1016/j.stem.2020.04.020. Epub 2020 May 26. Cell Stem Cell. 2020. PMID: 32459995 Free PMC article.
References
-
- Spemann H, Mangold H. Über Induktion von Embryonalanlagen durch Implantation artfremder Organisatoren. Roux Arch EntwMech Org. 1924:599–638.
-
- Nonaka S, Shiratori H, Saijoh Y, Hamada H. Determination of left-right patterning of the mouse embryo by artificial nodal flow. Nature. 2002;418:96–99. - PubMed
-
- Nonaka S, Tanaka Y, Okada Y, Takeda S, Harada A, Kanai Y, Kido M, Hirokawa N. Randomization of left-right asymmetry due to loss of nodal cilia generating leftward flow of extraembryonic fluid in mice lacking KIF3B motor protein. Cell. 1998;95:829–837. - PubMed
-
- Okada Y, Nonaka S, Tanaka Y, Saijoh Y, Hamada H, Hirokawa N. Abnormal nodal flow precedes situs inversus in iv and inv mice. Mol Cell. 1999;4:459–468. - PubMed
-
- Le Douarin NM, Halpern ME. Discussion point. Origin and specification of the neural tube floor plate: insights from the chick and zebrafish. Curr Opin Neurobiol. 2000;10:23–30. - PubMed
Publication types
MeSH terms
Substances
Grants and funding
LinkOut - more resources
Full Text Sources
Research Materials
