. 2012 Jan;16(1):160-73.
doi: 10.1111/j.1582-4934.2011.01282.x.

Functional analysis of microRNAs in human hepatocellular cancer stem cells

Affiliations

Functional analysis of microRNAs in human hepatocellular cancer stem cells

Fanyin Meng et al. J Cell Mol Med. 2012 Jan.

Abstract

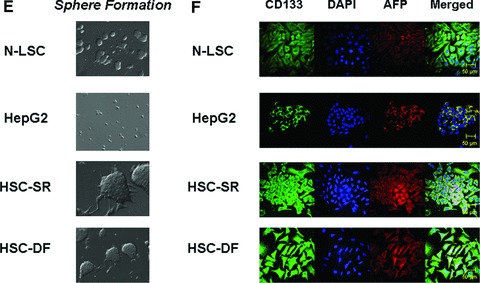
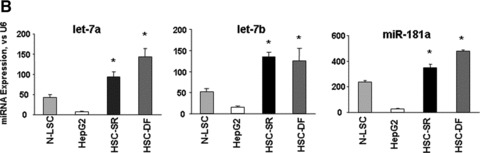
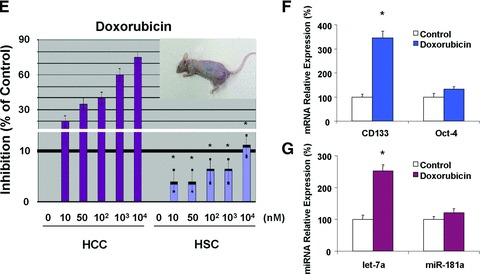
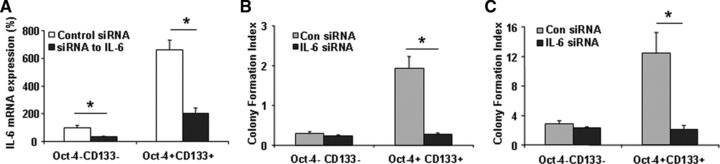
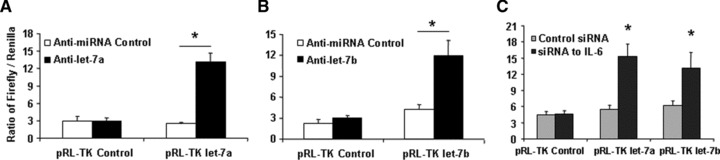
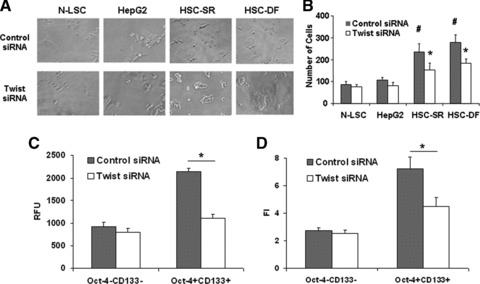
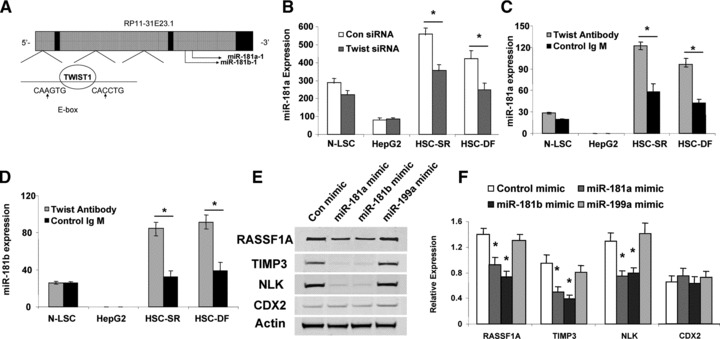
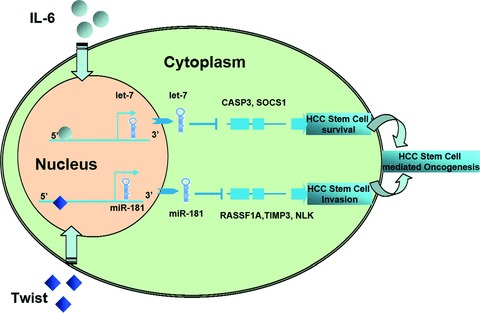
MicroRNAs are endogenous small non-coding RNAs that regulate gene expression and cancer development. A rare population of hepatocellular cancer stem cells (HSCs) holds the extensive proliferative and self-renewal potential necessary to form a liver tumour. We postulated that specific transcriptional factors might regulate the expression of microRNAs and subsequently modulate the expression of gene products involved in phenotypic characteristics of HSCs. We evaluated the expression of microRNA in human HSCs by microarray profiling, and defined the target genes and functional effects of two groups of microRNA regulated by IL-6 and transcriptional factor Twist. A subset of highly chemoresistant and invasive HSCs was screened with aberrant expressions of cytokine IL-6 and Twist. We demonstrated that conserved let-7 and miR-181 family members were up-regulated in HSCs by global microarray-based microRNA profiling followed by validation with real-time polymerase chain reaction. Importantly, inhibition of let-7 increases the chemosensitivity of HSCs to sorafenib and doxorubicin whereas silencing of miR-181 led to a reduction in HSCs motility and invasion. Knocking down IL-6 and Twist in HSCs significantly reduced let-7 and miR-181 expression and subsequently inhibited chemoresistance and cell invasion. We showed that let-7 directly targets SOCS-1 and caspase-3, whereas miR-181 directly targets RASSF1A, TIMP3 as well as nemo-like kinase (NLK). In conclusion, alterations of IL-6- and Twist-regulated microRNA expression in HSCs play a part in tumour spreading and responsiveness to chemotherapy. Our results define a novel regulatory mechanism of let-7/miR-181s suggesting that let-7 and miR-181 may be molecular targets for eradication of hepatocellular malignancies.


Figures

Fig 1
Fig 1
Characterization of Cancer Stem Cells from human HCC tissues. (A) Real-time analysis of Oct 4, CD 133, Nestin, telom-erase, SSEA-4, AFP and CEA mRNA expression in HCC stem cell under self-renewal condition (HSC-SR), under differentiation (HSC-DF) and HepG2 HCC cells. All the markers are significantly up-regulated in HCC cancer stem cells. *P < 0.05 when compared with HepG2 group. (B) FACS analysis of HCC stem cells on day 1 before cell sorting. Results are given as the percentage of Oct-4 and CD133+ cells in the total population. In the histograms, the red line represents staining with Oct-4 or CD133 mAb, and the green lines represent the isotype control-matched mAb. (C) Cell lysates were obtained and immunoblotting analysis was performed for Oct-4, CD133, α-fetoprotein (AFP), CK-7, CK-19 and EpiCam using specific antibodies. The blots were stripped and reprobed for β-actin as a loading control and for quantitation. (D) StemTAG™ Alkaline Phosphatase assays performed at passage 4–6 HSCs and LSCs. HSC-SR and LSCs are maintained in an undifferentiated stage on specific culture dishes, as indicated by the high AP activity, thus confirming the self-renewal within these cells. (E) Formation of tumour spheres in HCC stem cells. In 1% FCS culture media 70–90% of the HSC-SR and HSC-DF became adherent after 7 days, with a minority of floating cells forming spheres composed of three to five cells. After an additional 7 days, the floating spheres were expanded to contain 15–20 HSC-SR cells, with bright appearance and sharp edge. (F) Immunocytochemistry for CD133 and AFP was performed in Normal liver stem cells (N-LSC), HepG2 cells, hepatocellular cancer stem cells growing under self-renewal conditions (HSC-SR) and differentiation conditions (HSC-DF). An increase in CD133 expression along with the enhanced expression of AFP is observed in HSC-SR and HSC-DF cells.
Fig 1
Fig 1
Characterization of Cancer Stem Cells from human HCC tissues. (A) Real-time analysis of Oct 4, CD 133, Nestin, telom-erase, SSEA-4, AFP and CEA mRNA expression in HCC stem cell under self-renewal condition (HSC-SR), under differentiation (HSC-DF) and HepG2 HCC cells. All the markers are significantly up-regulated in HCC cancer stem cells. *P < 0.05 when compared with HepG2 group. (B) FACS analysis of HCC stem cells on day 1 before cell sorting. Results are given as the percentage of Oct-4 and CD133+ cells in the total population. In the histograms, the red line represents staining with Oct-4 or CD133 mAb, and the green lines represent the isotype control-matched mAb. (C) Cell lysates were obtained and immunoblotting analysis was performed for Oct-4, CD133, α-fetoprotein (AFP), CK-7, CK-19 and EpiCam using specific antibodies. The blots were stripped and reprobed for β-actin as a loading control and for quantitation. (D) StemTAG™ Alkaline Phosphatase assays performed at passage 4–6 HSCs and LSCs. HSC-SR and LSCs are maintained in an undifferentiated stage on specific culture dishes, as indicated by the high AP activity, thus confirming the self-renewal within these cells. (E) Formation of tumour spheres in HCC stem cells. In 1% FCS culture media 70–90% of the HSC-SR and HSC-DF became adherent after 7 days, with a minority of floating cells forming spheres composed of three to five cells. After an additional 7 days, the floating spheres were expanded to contain 15–20 HSC-SR cells, with bright appearance and sharp edge. (F) Immunocytochemistry for CD133 and AFP was performed in Normal liver stem cells (N-LSC), HepG2 cells, hepatocellular cancer stem cells growing under self-renewal conditions (HSC-SR) and differentiation conditions (HSC-DF). An increase in CD133 expression along with the enhanced expression of AFP is observed in HSC-SR and HSC-DF cells.
Fig 2
Fig 2
The expressions of Twist and IL-6 are up-regulated in HCC cancer stem cells. (A) Relative gene expression profile between HSC stem cells (HSC-SR) versus HepG2 cells is shown. The expression of a panel of diverse cancer-associated genes was evaluated by real-time polymerase chain reaction (PCR) using Human Cancer & Estrogen Receptor Signalling PCR Array (#PAHS005, A) as well as Cancer Pathway Finder PCR Array (#PAHS033, B) from SABioscience Corporation (Frederick, MD, USA). Gene expression relative to glyceraldehyde-3-phosphate dehydrogenase was plotted as the Volcano Plots, depicting the relative expression levels (Log2) for selected genes in HSC-SR versus HepG2 control panels (A and B, Top). The relative expression levels and P values for each gene in the related samples were also plotted against each other in the scatter plot (A and B, Bottom). IL-6 and Twist are the most up-regulated genes among the 10 cancer signalling pathways in HCC stem cells. (C) Total RNA was extracted from N-LSC, HepG2, HSC-SR, HSC-DF cells and Twist and IL-6 mRNA expressions were assessed by quantitative real-time PCR. The relative mRNA expression was normalized to expression of N-LSC as percentage of control. *P < 0.05 when compared with mRNA expression of N-LSC and HepG2 cells. (D) The expression of phosphor-Stat3, Twist and downstream protein N-Cadherin CDH2) is up-regulated in HSCs. Western blots of cell lysates were performed and sequentially probed with antibodies against Twist, P-Stat3, CDH2 and β-actin as a loading control in hepatocytes and HCC stem cells as indicated. Representative immunoblots are shown.
Fig 3
Fig 3
miRNA expression profiles in human HCC cancer stem cells [under self-renewal (SR) or differentiation (DF)], malignant and non-malignant hepatocytes. (A) miRNA was isolated and profiling by hybridization to miRNA-specific probes on epoxy-coated slides. Cluster analysis identifies a group of miRNA that are increased in expression in HCC cancer stem cells (HSC-SR and HSC-DF) and reduced in hepG2 cells when compared to normal human liver stem cells (Cluster 2). An enlarged view of this group, containing 11 miRNAs including members of let-7 and miR-181 family is shown. Lower middle panel illustrated representative Northern blot analysis of let-7a and miR-181a using total RNA isolated from four cell lines. This cluster of miRNAs are among the group, which increased in HSC-SR by fourfold, and P < 0.05 when compared to HepG2 cells (lower right panel). (B) The expressions of mature let-7a, let-7b and miR-181a miRNAs were validated using real-time PCR and correlated with the pattern in the miRNA array. Data represent mean ± S.E. from four separate experiments.
Fig 3
Fig 3
miRNA expression profiles in human HCC cancer stem cells [under self-renewal (SR) or differentiation (DF)], malignant and non-malignant hepatocytes. (A) miRNA was isolated and profiling by hybridization to miRNA-specific probes on epoxy-coated slides. Cluster analysis identifies a group of miRNA that are increased in expression in HCC cancer stem cells (HSC-SR and HSC-DF) and reduced in hepG2 cells when compared to normal human liver stem cells (Cluster 2). An enlarged view of this group, containing 11 miRNAs including members of let-7 and miR-181 family is shown. Lower middle panel illustrated representative Northern blot analysis of let-7a and miR-181a using total RNA isolated from four cell lines. This cluster of miRNAs are among the group, which increased in HSC-SR by fourfold, and P < 0.05 when compared to HepG2 cells (lower right panel). (B) The expressions of mature let-7a, let-7b and miR-181a miRNAs were validated using real-time PCR and correlated with the pattern in the miRNA array. Data represent mean ± S.E. from four separate experiments.
Fig 4
Fig 4
HCC stem cells are resistant to conventional chemotherapy. (A, C) After serum starvation of cultured cells overnight, sorafenib and doxorubicin were added at various concentrations (103–10−10 M) and cell viability was assessed after 72 hrs. IC50 graph of high-content image analysis of human hepatocytes and HCC stem cells treated by sorafenib and doxorubicin was illustrated. Quantitative data of MTS assay in the sorafenib treated cells were calculated for IC50 with XLfit software, which is marked in the middle of the box. (B, D) IC50 of sorafenib and doxorubicin in hepato-cytes and HCC stem cells is illustrated in bar graph. HCC stem cells under either self-renewal (HSC-SR) or differentiation (HSC-DF) are more resistance to sorafenib and doxorubicin than HepG2 cells and normal liver stem cells. IC50 results are expressed as the mean ± S.E. of eight different experiments. (E) Groups of five SCID Berge mice were selected 8–10 weeks old per treatment group. The human HSC-SRs (1000) as well as parental HCC cells (5 × 10⁶) were injected subcutaneously and allowed to engraft for 10 days. At day 10 the tumour was visible, and then the doxorubicin treatment was started and the mice received the desired concentration of the drug intraper-oteneal three times per week for 14 days. At the end of the 14 days the tumour was dissociated into single cell suspension and assayed with Almar Blue to determine percent inhibition of the drug. (F, G) Differential expression of CD133 and let-7a in vivo following treatment with doxorubicin by real-time PCR is shown. Data represent percentage change in expression in doxo-cibicin-treated tumours compared with controls. *P < 0.05 relative to controls.
Fig 4
Fig 4
HCC stem cells are resistant to conventional chemotherapy. (A, C) After serum starvation of cultured cells overnight, sorafenib and doxorubicin were added at various concentrations (103–10−10 M) and cell viability was assessed after 72 hrs. IC50 graph of high-content image analysis of human hepatocytes and HCC stem cells treated by sorafenib and doxorubicin was illustrated. Quantitative data of MTS assay in the sorafenib treated cells were calculated for IC50 with XLfit software, which is marked in the middle of the box. (B, D) IC50 of sorafenib and doxorubicin in hepato-cytes and HCC stem cells is illustrated in bar graph. HCC stem cells under either self-renewal (HSC-SR) or differentiation (HSC-DF) are more resistance to sorafenib and doxorubicin than HepG2 cells and normal liver stem cells. IC50 results are expressed as the mean ± S.E. of eight different experiments. (E) Groups of five SCID Berge mice were selected 8–10 weeks old per treatment group. The human HSC-SRs (1000) as well as parental HCC cells (5 × 10⁶) were injected subcutaneously and allowed to engraft for 10 days. At day 10 the tumour was visible, and then the doxorubicin treatment was started and the mice received the desired concentration of the drug intraper-oteneal three times per week for 14 days. At the end of the 14 days the tumour was dissociated into single cell suspension and assayed with Almar Blue to determine percent inhibition of the drug. (F, G) Differential expression of CD133 and let-7a in vivo following treatment with doxorubicin by real-time PCR is shown. Data represent percentage change in expression in doxo-cibicin-treated tumours compared with controls. *P < 0.05 relative to controls.
Fig 5
Fig 5
IL-6 is involved in HCC stem cells survival. (A) Total RNA was extracted and IL-6 expression was assessed by quantitative real-time PCR. *P < 0.05 when compared with Control siRNA group. (B, C) Oct-4+CD133+ and Oct-4CD133 HCC stem cells were seeded in 96-well plates (10,000 per well) in specific medium with 20% FBS with sorafenib (B) and doxorubicin (C, 10 μM). Cells were incubated for 7 days in a humidified incubator at 37°C, after which the total number of colonies was labelled by Calcein AM (Molecular Probes, Eugene, OR, USA) and quantified fluorometrically. Colony survival rate of Oct-4+CD133+ and Oct-4CD133 HCC stem cells were shown after 7-day exposure to sorafenib and doxorubicin (10 μM) in soft agar. The surrogate cancer stem cell assay has demonstrated that silencing IL-6 significantly reduced transformed HCC cancer stem cell survival rate.
Fig 6
Fig 6
MicroRNA let-7 is involved in the HCC stem cell resistance to chemotherapy. (A, B) To validate the efficacy of the anti-let-7 inhibitor, HCC stem cells plated (2 × 10⁶ cells/well) in six-well plates were transfected with 1 μg of pRL-TK let-7a or let-7b (firefly luciferase construct), 1 μg of pRL-TK (Renilla luciferase construct), and either anti-let-7a (A), anti-let-7b (B) or control inhibitor. Luciferase assays were performed 48 hrs after transfection. The anti-let-7a (anti-let-7b) inhibitor directly blocked the effect of endogenous let-7a (let-7b) on the luciferase reporter. (C) siRNA to IL-6 or control was trans-fected with 1 μg of pRL-TK let-7a or let-7b (firefly luciferase construct), 1 μg of pRL-TK (Renilla luciferase construct). Dual-luciferase assay has demonstrated that silencing IL-6 significantly increased the miRNA expressions of let-7 family. (D, E) Human hepatocytes and HCC stem cells were seeded in a 96-well plate and incubated with different concentrations of sorafenib. The MTS assays were performed 72 hrs after treatment. The data were expressed as percentage of control group. The IC50 values were calculated with Excel XLFit program and marked in the middle of the box. (D) Illustrates the detailed IC50 analysis in different cell lines with anti-let-7a treatment whereas E exemplified IC50 results expressed as the mean ± S.E. of eight different experiments. Silencing of let-7a significantly sensitizes HCC cancer stem cells to sorafenib treatment. (F, G) The expression of SOCS1 and downstream kinase is regulated by let-7a. Western blots of cell lysates were performed and sequentially probed with antibodies against SOCS1, Caspase-3, phospho and total Stat3, and tubulin as a loading control in HepG2 or HSC-SR cells transfected with let-7a mimics or inhibitors with related controls. Representative immunoblots (F) and quantitative data (G, mean ± S.E.) from four separate blots are shown.
Fig 6
Fig 6
MicroRNA let-7 is involved in the HCC stem cell resistance to chemotherapy. (A, B) To validate the efficacy of the anti-let-7 inhibitor, HCC stem cells plated (2 × 10⁶ cells/well) in six-well plates were transfected with 1 μg of pRL-TK let-7a or let-7b (firefly luciferase construct), 1 μg of pRL-TK (Renilla luciferase construct), and either anti-let-7a (A), anti-let-7b (B) or control inhibitor. Luciferase assays were performed 48 hrs after transfection. The anti-let-7a (anti-let-7b) inhibitor directly blocked the effect of endogenous let-7a (let-7b) on the luciferase reporter. (C) siRNA to IL-6 or control was trans-fected with 1 μg of pRL-TK let-7a or let-7b (firefly luciferase construct), 1 μg of pRL-TK (Renilla luciferase construct). Dual-luciferase assay has demonstrated that silencing IL-6 significantly increased the miRNA expressions of let-7 family. (D, E) Human hepatocytes and HCC stem cells were seeded in a 96-well plate and incubated with different concentrations of sorafenib. The MTS assays were performed 72 hrs after treatment. The data were expressed as percentage of control group. The IC50 values were calculated with Excel XLFit program and marked in the middle of the box. (D) Illustrates the detailed IC50 analysis in different cell lines with anti-let-7a treatment whereas E exemplified IC50 results expressed as the mean ± S.E. of eight different experiments. Silencing of let-7a significantly sensitizes HCC cancer stem cells to sorafenib treatment. (F, G) The expression of SOCS1 and downstream kinase is regulated by let-7a. Western blots of cell lysates were performed and sequentially probed with antibodies against SOCS1, Caspase-3, phospho and total Stat3, and tubulin as a loading control in HepG2 or HSC-SR cells transfected with let-7a mimics or inhibitors with related controls. Representative immunoblots (F) and quantitative data (G, mean ± S.E.) from four separate blots are shown.
Fig 7
Fig 7
Twist is involved in cell motility and invasion potentials if HCC stem cells. (A) Light microscopy was used to document morphologic differences between the Twist and control siRNA treated N-LSC, HepG2 and HSCs. HSCs displayed an aggressive phenotype, which became elongated, and forming the leading edge pseudopodia. Silencing Twist in HSCs significantly reduced the percentage of cells with invasive phenotypes. (B) Matrigel invasion assay showing the invading capability of normal and malignant liver stem cells with and without Twist silencing. (C, D) Cell migration and invasion was assessed in Oct-4+CD133+ and Oct-4CD133 cells with or without Twist silencing. Cell migration was expressed as arbitrary fluorescence units. Cell invasion was assessed in 96-well plates pre-coated with extracellular matrix. RFU is the absolute florescence intensity value and FI is the florescence intensity after normalization with the standard curve. The mean and standard error from four separate experiments are illustrated. #P < 0.05 when compare with HepG2 and N-LSC groups. *P < 0.05 when compared with siRNA controls.
Fig 8
Fig 8
Regulation of miR-181 expression by Twist in HCC stem cells. (A) The schematic diagrams of miR-181 genes showing the Twist1 binding e-boxes are located in 5′-promoter regions of miR-181a-1/miR-181b-1. (B) Real-time PCR confirmed reduced expression of mature miR-181a in HSC-SR and HSC-DF cells in Twist silencing group when compared with expression in their respective controls. (C, D) Total RNAs were isolated using Magna RIP™ RNA-Binding Protein Immunoprecipitation Kit and real-time PCR assay was carried out using Taqman MicroRNA Assay kit. Increased miR-181a and miR-181b binding with Twist were observed in HCC cancer stem cells under self-renewal or differentiation condition. *P < 0.05 when compared with respective controls. (E, F) Overexpression of miR-181a and miR-181b inhibited RASSF1A, TIMP3 and NLK protein expressions in HSCs. Representative immunoblots (E) and quantitative data (F, mean ± S.E.) from four separate blots are shown. *P < 0.05 relative to expression in controls.
Fig 9
Fig 9
Targeting of SOCS1 and CASP3 3′-UTR by let-7, as well as RASSF1A, TIMP3 and NLK by miR-181a. Firefly luciferase activity was normalized to Renilla luciferase activity for each sample. Top: The sequences of the mutated target sites of SOCS1, CASP3, RASSF1A, TIMP3 and NLK with mutations to disrupt base pairing between the specific binding sites and microRNAs are also displayed. Bottom: The decreases in relative firefly luciferase with pMIR-WT-luc compared with the pMIR- MUT-luc constructs in let-7a and let-7b overexpressed cells (A), as well as miR-181a overexpressed cells (B) confirms that the SOCS1 and CASP3 (RASSF1A, TIMP3 and NLK) complementary sequence in the 3′-UTR and the genes are the direct targets of modulation by let-7a and let-7b (miR-181a). The data represent the mean and standard errors from four independent transfections. *P < 0.05 relative to respective controls.
Fig 9
Fig 9
Targeting of SOCS1 and CASP3 3′-UTR by let-7, as well as RASSF1A, TIMP3 and NLK by miR-181a. Firefly luciferase activity was normalized to Renilla luciferase activity for each sample. Top: The sequences of the mutated target sites of SOCS1, CASP3, RASSF1A, TIMP3 and NLK with mutations to disrupt base pairing between the specific binding sites and microRNAs are also displayed. Bottom: The decreases in relative firefly luciferase with pMIR-WT-luc compared with the pMIR- MUT-luc constructs in let-7a and let-7b overexpressed cells (A), as well as miR-181a overexpressed cells (B) confirms that the SOCS1 and CASP3 (RASSF1A, TIMP3 and NLK) complementary sequence in the 3′-UTR and the genes are the direct targets of modulation by let-7a and let-7b (miR-181a). The data represent the mean and standard errors from four independent transfections. *P < 0.05 relative to respective controls.
Fig 10
Fig 10
IL-6/Twist promotes hepatocellular cancer stem cell survival/invasion by activation of miRNA-dependent signalling pathways.

Similar articles

Cited by

References

    1. Adams JM, Strasser A. Is tumor growth sustained by rare cancer stem cells or dominant clones? Cancer Res. 2008;68:4018–21. - PubMed
    1. Alvero AB, Chen R, Fu HH, et al. Molecular phenotyping of human ovarian cancer stem cells unravels the mechanisms for repair and chemoresistance. Cell Cycle. 2009;8:158–66. - PMC - PubMed
    1. Mishra L, Banker T, Murray J, et al. Liver stem cells and hepatocellular carcinoma. Hepatology. 2009;49:318–29. - PMC - PubMed
    1. Rosa A, Brivanlou AH. microRNAs in early vertebrate development. Cell Cycle. 2009;8:3513–20. - PubMed
    1. Sartipy P, Olsson B, Hyllner J, Synnergren J. Regulation of ‘stemness’ and stem cell differentiation by microRNAs. IDrugs. 2009;12:492–6. - PubMed

Publication types

MeSH terms