

Cardiac filling volumes versus pressures for predicting fluid responsiveness after cardiovascular surgery: the role of systolic cardiac function
- PMID: 21352541
- PMCID: PMC3222006
- DOI: 10.1186/cc10062
Cardiac filling volumes versus pressures for predicting fluid responsiveness after cardiovascular surgery: the role of systolic cardiac function
Abstract
Introduction: Static cardiac filling volumes have been suggested to better predict fluid responsiveness than filling pressures, but this may not apply to hearts with systolic dysfunction and dilatation. We evaluated the relative value of cardiac filling volume and pressures for predicting and monitoring fluid responsiveness, according to systolic cardiac function, estimated by global ejection fraction (GEF, normal 25 to 35%) from transpulmonary thermodilution.
Methods: We studied hypovolemic, mechanically ventilated patients after coronary (n = 18) or major vascular (n = 14) surgery in the intensive care unit. We evaluated 96 colloid fluid loading events (200 to 600 mL given in three consecutive 30-minute intervals, guided by increases in filling pressures), divided into groups of responding events (fluid responsiveness) and non-responding events, in patients with low GEF (<20%) or near-normal GEF (≥ 20%). Patients were monitored by transpulmonary dilution and central venous (n = 9)/pulmonary artery (n = 23) catheters to obtain cardiac index (CI), global end-diastolic volume index (GEDVI), central venous (CVP) and pulmonary artery occlusion pressure (PAOP).
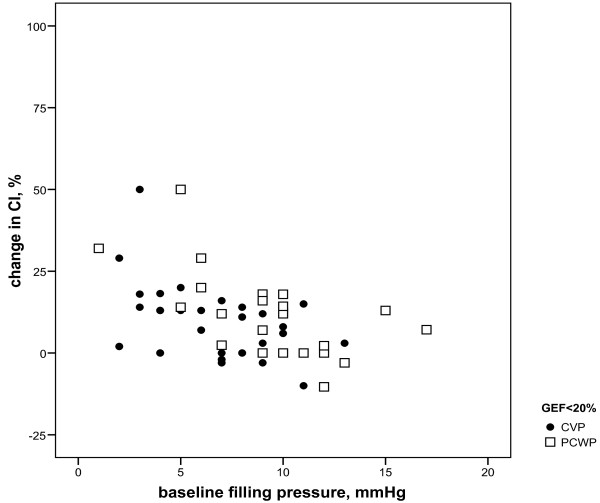
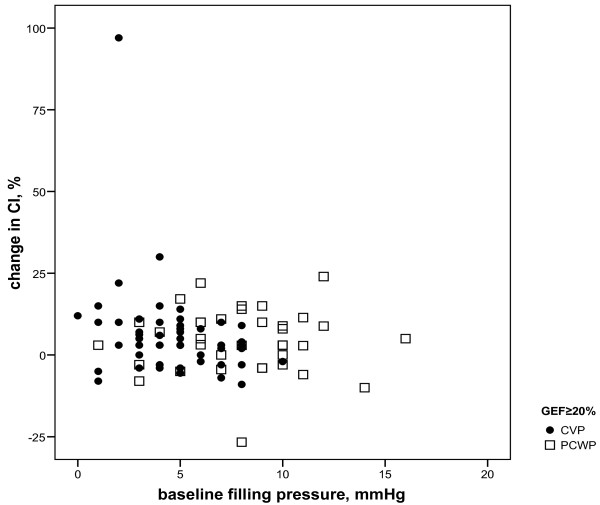
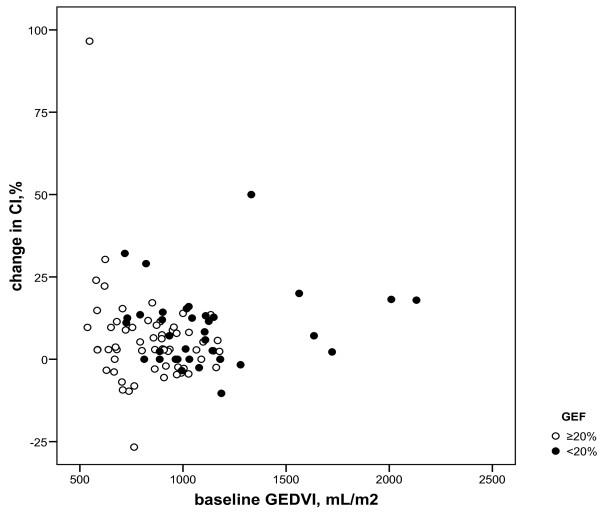
Results: Fluid responsiveness occurred in 8 (≥ 15% increase in CI) and 17 (≥ 10% increase in CI) of 36 fluid loading events when GEF was <20%, and 7 (≥ 15% increase in CI) and 17 (≥ 10% increase in CI) of 60 fluid loading events when GEF was ≥ 20%. Whereas a low baseline GEDVI predicted fluid responsiveness particularly when GEF was ≥ 20% (P = 0.002 or lower), a low PAOP was of predictive value particularly when GEF was <20% (P = 0.004 or lower). The baseline CVP was lower in responding events regardless of GEF. Changes in CVP and PAOP paralleled changes in CI particularly when GEF was <20%, whereas changes in GEDVI paralleled CI regardless of GEF.
Conclusions: Regardless of GEF, CVP may be useful for predicting fluid responsiveness in patients after coronary and major vascular surgery provided that positive end-expiratory pressure is low. When GEF is low (<20%), PAOP is more useful than GEDVI for predicting fluid responsiveness, but when GEF is near-normal (≥20%) GEDVI is more useful than PAOP. This favors predicting and monitoring fluid responsiveness by pulmonary artery catheter-derived filling pressures in surgical patients with systolic left ventricular dysfunction and by transpulmonary thermodilution-derived GEDVI when systolic left ventricular function is relatively normal.
Figures
References
-
- Gödje O, Peyerl M, Seebauer T, Dewald O, Reichart B. Reproducibility of double indicator dilution measurements of intrathoracic blood volume compartments, extravascular lung water, and liver function. Chest. 1998;113:1070–1077. - PubMed
-
- Harvey S, Young D, Brampton W, Cooper AB, Doig G, Sibbald W, Rowan K. Pulmonary artery catheters for adult patients in intensive care. Cochrane Database Syst Rev. 2006;3:CD003408. - PubMed
-
- Breukers RM, Trof RJ, Groeneveld AB. In: Yearbook of Intensive Care and Emergency Medicine. Vincent J-L, editor. Springer, Berlin, Germany; 2009. Cardiac filling volumes and pressure in assessing preload responsiveness during fluid challenges; pp. 265–275. full_text.
Publication types
MeSH terms
LinkOut - more resources
Full Text Sources
Medical
