

Expression profile analysis of the inflammatory response regulated by hepatocyte nuclear factor 4α
- PMID: 21352552
- PMCID: PMC3053261
- DOI: 10.1186/1471-2164-12-128
Expression profile analysis of the inflammatory response regulated by hepatocyte nuclear factor 4α
Abstract
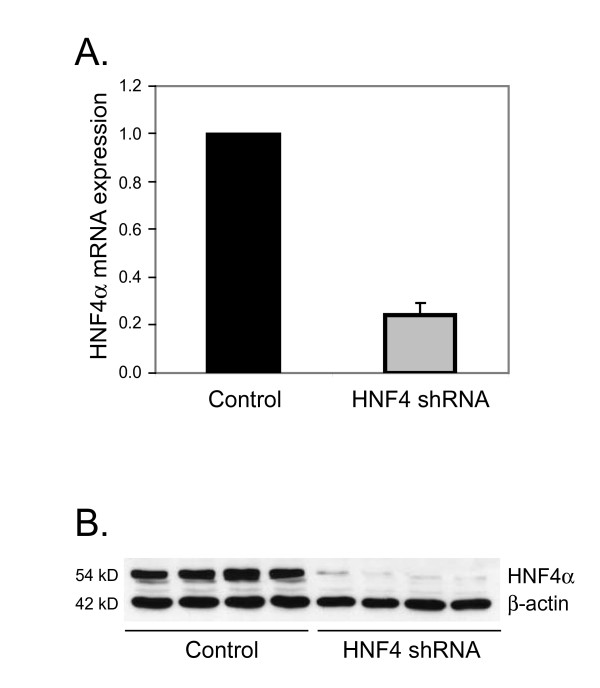
Background: Hepatocyte nuclear factor 4α (HNF4α), a liver-specific transcription factor, plays a significant role in liver-specific functions. However, its functions are poorly understood in the regulation of the inflammatory response. In order to obtain a genomic view of HNF4α in this context, microarray analysis was used to probe the expression profile of an inflammatory response induced by cytokine stimulation in a model of HNF4α knock-down in HepG2 cells.
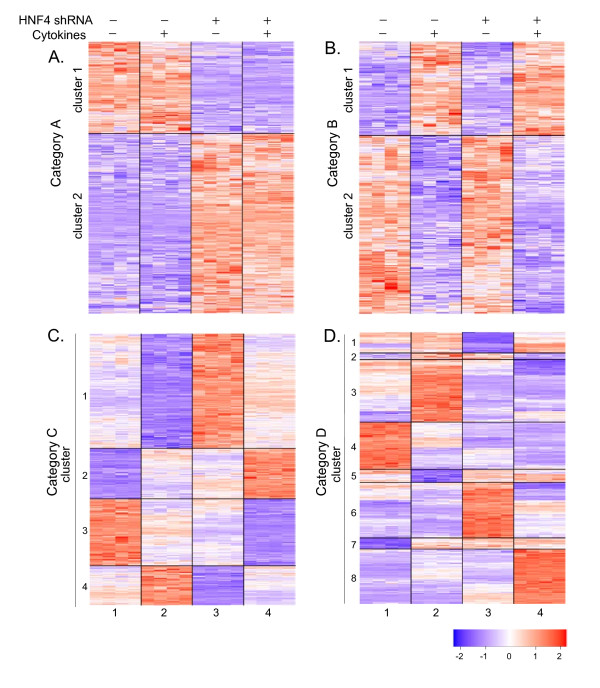
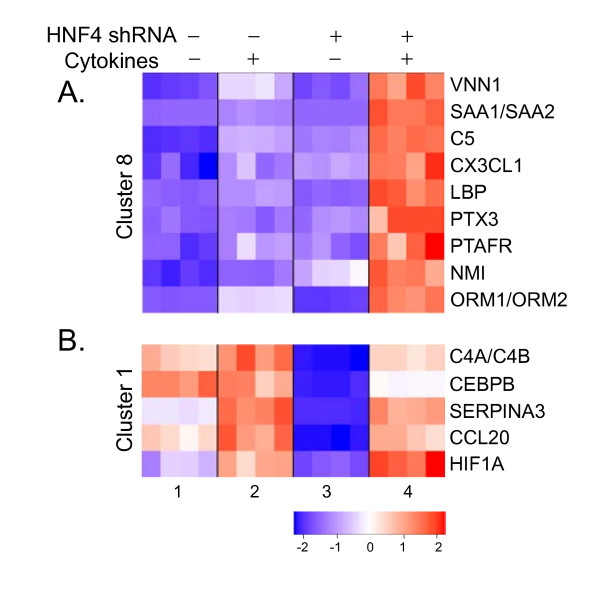
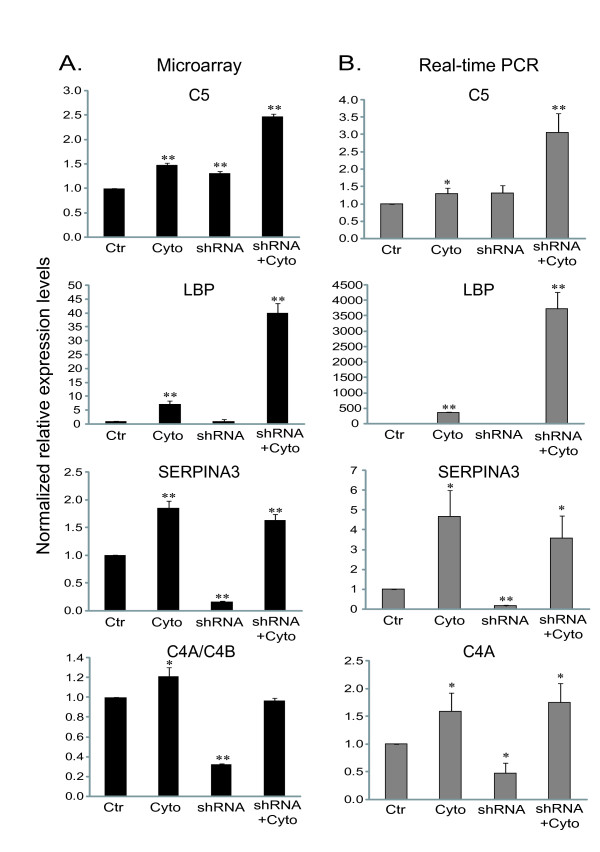
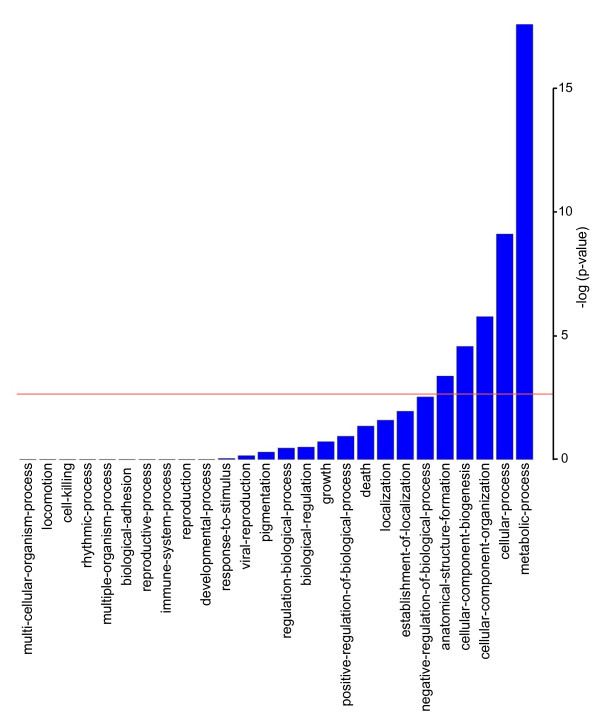
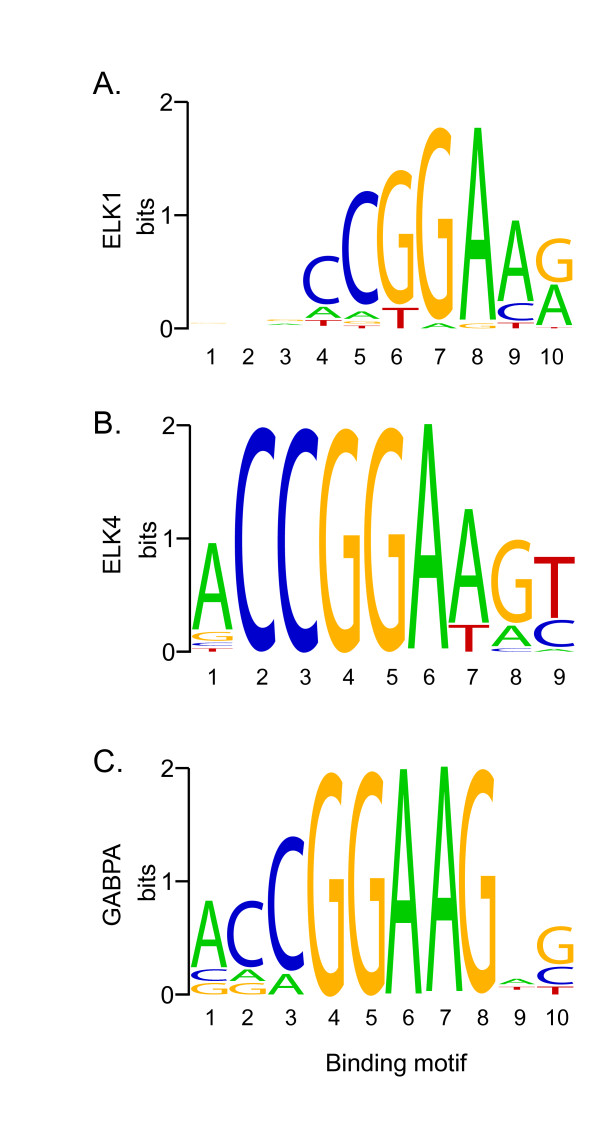
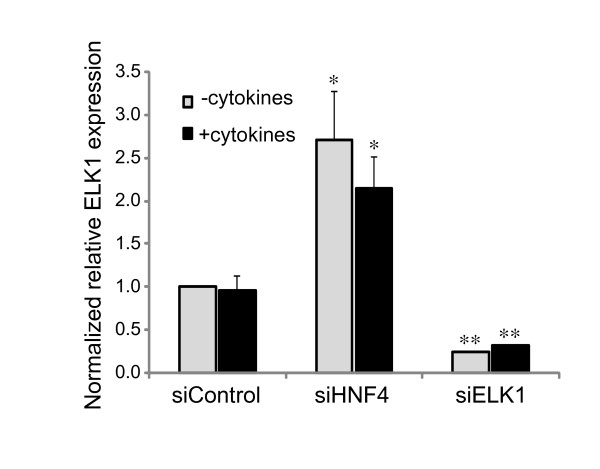
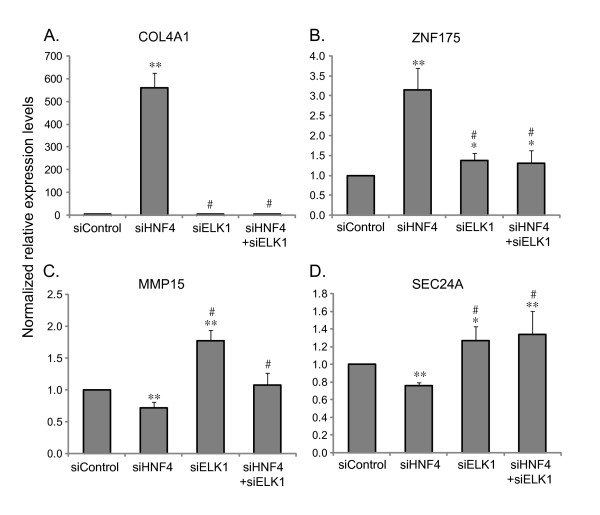
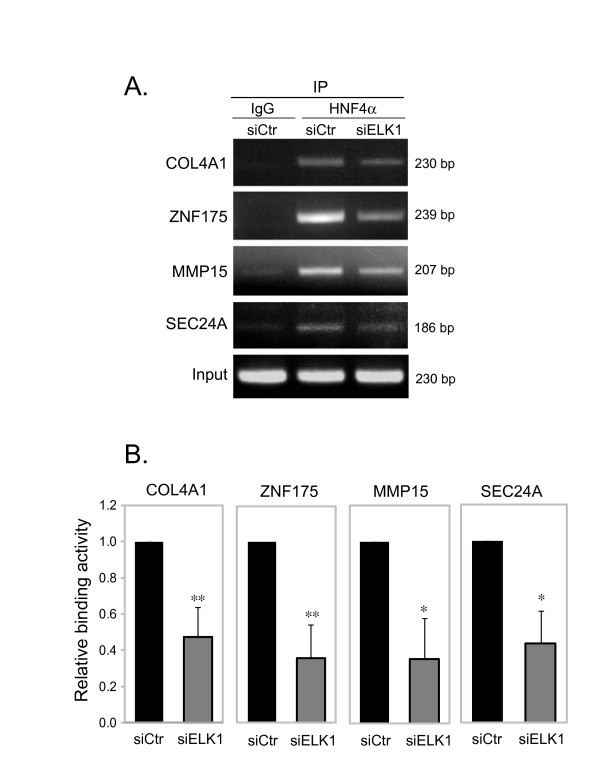
Results: The expression of over five thousand genes in HepG2 cells is significantly changed with the dramatic reduction of HNF4α concentration compared to the cells with native levels of HNF4α. Over two thirds (71%) of genes that exhibit differential expression in response to cytokine treatment also reveal differential expression in response to HNF4α knock-down. In addition, we found that a number of HNF4α target genes may be indirectly mediated by an ETS-domain transcription factor ELK1, a nuclear target of mitogen-activated protein kinase (MAPK).
Conclusion: The results indicate that HNF4α has an extensive impact on the regulation of a large number of the liver-specific genes. HNF4α may play a role in regulating the cytokine-induced inflammatory response. This study presents a novel function for HNF4α, acting not only as a global player in many cellular processes, but also as one of the components of inflammatory response in the liver.
Figures
Similar articles
-
Hepatocyte nuclear factor 4α regulates the expression of the murine pyruvate carboxylase gene through the HNF4-specific binding motif in its proximal promoter.Biochim Biophys Acta. 2013 Oct;1829(10):987-99. doi: 10.1016/j.bbagrm.2013.05.001. Epub 2013 May 9. Biochim Biophys Acta. 2013. PMID: 23665043
-
Complex interplay between the lipin 1 and the hepatocyte nuclear factor 4 α (HNF4α) pathways to regulate liver lipid metabolism.PLoS One. 2012;7(12):e51320. doi: 10.1371/journal.pone.0051320. Epub 2012 Dec 7. PLoS One. 2012. PMID: 23236470 Free PMC article.
-
CCAAT-enhancer binding protein-α (C/EBPα) and hepatocyte nuclear factor 4α (HNF4α) regulate expression of the human fructose-1,6-bisphosphatase 1 (FBP1) gene in human hepatocellular carcinoma HepG2 cells.PLoS One. 2018 Mar 22;13(3):e0194252. doi: 10.1371/journal.pone.0194252. eCollection 2018. PLoS One. 2018. PMID: 29566023 Free PMC article.
-
Regulation of hepatocyte nuclear factor 4 alpha-mediated transcription.Drug Metab Pharmacokinet. 2008;23(1):2-7. doi: 10.2133/dmpk.23.2. Drug Metab Pharmacokinet. 2008. PMID: 18305369 Review.
-
Role of hepatocyte nuclear factor 4α (HNF4α) in cell proliferation and cancer.Gene Expr. 2015;16(3):101-8. doi: 10.3727/105221615X14181438356292. Gene Expr. 2015. PMID: 25700366 Free PMC article. Review.
Cited by
-
Genomic characterization of remission in juvenile idiopathic arthritis.Arthritis Res Ther. 2013 Aug 30;15(4):R100. doi: 10.1186/ar4280. Arthritis Res Ther. 2013. PMID: 24000795 Free PMC article.
-
The role of microRNAs in hepatocyte nuclear factor-4alpha expression and transactivation.Biochim Biophys Acta. 2013 May;1829(5):436-42. doi: 10.1016/j.bbagrm.2012.12.009. Epub 2013 Jan 5. Biochim Biophys Acta. 2013. PMID: 23298640 Free PMC article.
-
Hepatocyte nuclear factor 4-alpha involvement in liver and intestinal inflammatory networks.World J Gastroenterol. 2014 Jan 7;20(1):22-30. doi: 10.3748/wjg.v20.i1.22. World J Gastroenterol. 2014. PMID: 24415854 Free PMC article. Review.
-
A cross-species approach to identify transcriptional regulators exemplified for Dnajc22 and Hnf4a.Sci Rep. 2017 Jun 22;7(1):4056. doi: 10.1038/s41598-017-04370-9. Sci Rep. 2017. PMID: 28642491 Free PMC article.
-
Bisphenol A Disrupts HNF4α-Regulated Gene Networks Linking to Prostate Preneoplasia and Immune Disruption in Noble Rats.Endocrinology. 2016 Jan;157(1):207-19. doi: 10.1210/en.2015-1363. Epub 2015 Oct 23. Endocrinology. 2016. PMID: 26496021 Free PMC article.
References
-
- Costa RH, Kalinichenko VV, Holterman AX, Wang X. Transcription factors in liver development, differentiation, and regeneration. Hepatology. 2003;38(6):1331–1347. - PubMed
-
- Clotman F, Lannoy VJ, Reber M, Cereghini S, Cassiman D, Jacquemin P, Roskams T, Rousseau GG, Lemaigre FP. The onecut transcription factor HNF6 is required for normal development of the biliary tract. Development. 2002;129(8):1819–1828. - PubMed
Publication types
MeSH terms
Substances
LinkOut - more resources
Full Text Sources
Molecular Biology Databases
