. 2011 Feb 27:10:23.
doi: 10.1186/1476-4598-10-23.

Expression analysis of mitotic spindle checkpoint genes in breast carcinoma: role of NDC80/HEC1 in early breast tumorigenicity, and a two-gene signature for aneuploidy

Affiliations

Expression analysis of mitotic spindle checkpoint genes in breast carcinoma: role of NDC80/HEC1 in early breast tumorigenicity, and a two-gene signature for aneuploidy

Ivan Bièche et al. Mol Cancer. .

Abstract

Background: Aneuploidy and chromosomal instability (CIN) are common abnormalities in human cancer. Alterations of the mitotic spindle checkpoint are likely to contribute to these phenotypes, but little is known about somatic alterations of mitotic spindle checkpoint genes in breast cancer.

Methods: To obtain further insight into the molecular mechanisms underlying aneuploidy in breast cancer, we used real-time quantitative RT-PCR to quantify the mRNA expression of 76 selected mitotic spindle checkpoint genes in a large panel of breast tumor samples.

Results: The expression of 49 (64.5%) of the 76 genes was significantly dysregulated in breast tumors compared to normal breast tissues: 40 genes were upregulated and 9 were downregulated. Most of these changes in gene expression during malignant transformation were observed in epithelial cells.Alterations of nine of these genes, and particularly NDC80, were also detected in benign breast tumors, indicating that they may be involved in pre-neoplastic processes.We also identified a two-gene expression signature (PLK1 + AURKA) which discriminated between DNA aneuploid and DNA diploid breast tumor samples. Interestingly, some DNA tetraploid tumor samples failed to cluster with DNA aneuploid breast tumors.

Conclusion: This study confirms the importance of previously characterized genes and identifies novel candidate genes that could be activated for aneuploidy to occur. Further functional analyses are required to clearly confirm the role of these new identified genes in the molecular mechanisms involved in breast cancer aneuploidy. The novel genes identified here, and/or the two-gene expression signature, might serve as diagnostic or prognostic markers and form the basis for novel therapeutic strategies.


Figures

Figure 1
Figure 1
mRNA levels of 3 characteristic upregulated genes (NDC80, NEK2 and AURKA) according to breast tumor progression. Breast tumor progression groups are consisting of 9 normal breast tissues, 14 benign breast tumors, 14 ductal carcinoma in situ (DCIS), 11 invasive ductal grade I and 12 invasive ductal grade III breast tumors, respectively. Median values (ranges) and means +/- SD (in italics) are indicated for each tumor subgroup.
Figure 2
Figure 2
Involvement of 18 characteristic genes in different steps of breast tumor progression.
Figure 3
Figure 3
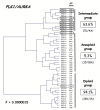
Dendrogram of 24 DNA diploid (xxxx-D) and 23 DNA aneuploid breast tumors (xxxx-A). We constructed the dendogram by hierarchical clustering, according to PLK1 and AURKA expression. The SPF value, categorized as low, intermediate or high, is indicated for each tumor. The percentages of diploid breast tumors in each subgroup are indicated on the right.
Figure 4
Figure 4
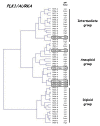
Dendrogram of 24 DNA diploid, 23 DNA aneuploid and 6 additional DNA aneuploid breast tumors. We constructed by hierarchical clustering, a dendrogram of 24 DNA diploid (xxxx-D), 23 DNA aneuploid (xxxx-A) and 6 additional DNA aneuploid breast tumors (xxxx-A-new; solid line rectangle), according to PLK1 and AURKA expression. The SPF value for each tumor, categorized as low, intermediate or high, is indicated on the right.
Figure 5
Figure 5
Dendogram of 24 DNA diploid, 23 DNA aneuploid and 8 DNA tetraploid breast tumors. We constructed by hierarchical clustering, a dendrogram of 24 DNA diploid (xxxx-D), 23 DNA aneuploid (xxxx-A) and 8 DNA tetraploid breast tumors (xxxx-T; solid line rectangle), according to PLK1 and AURKA expression. SPF value, categorized as low, intermediate or high, for each tumor is indicated on the right.

Similar articles

Cited by

References

    1. Ganem NJ, Storchova Z, Pellman D. Tetraploidy, aneuploidy and cancer. Curr Opin Genet Dev. 2007;17:157–62. doi: 10.1016/j.gde.2007.02.011. - DOI - PubMed
    1. Rajagopalan H, Lengauer C. Aneuploidy and cancer. Nature. 2004;432:338–41. doi: 10.1038/nature03099. - DOI - PubMed
    1. Cahill DP, Lengauer C, Yu J, Riggins GJ, Willson JK, Markowitz SD, Kinzler KW, Vogelstein B. Mutations of mitotic checkpoint genes in human cancers. Nature. 1998;392:300–3. doi: 10.1038/32688. - DOI - PubMed
    1. Zhou H, Kuang J, Zhong L, Kuo WL, Gray JW, Sahin A, Brinkley BR, Sen S. Tumour amplified kinase STK15/BTAK induces centrosome amplification, aneuploidy and transformation. Nat Genet. 1998;20:189–93. doi: 10.1038/2496. - DOI - PubMed
    1. Hayward DG, Clarke RB, Faragher AJ, Pillai MR, Hagan IM, Fry AM. The centrosomal kinase Nek2 displays elevated levels of protein expression in human breast cancer. Cancer Res. 2004;64:7370–6. doi: 10.1158/0008-5472.CAN-04-0960. - DOI - PubMed

Publication types

MeSH terms