Comparative Study
. 2011 Jun 1;56(3):1082-104.
doi: 10.1016/j.neuroimage.2011.02.054. Epub 2011 Feb 23.

Measuring functional connectivity using MEG: methodology and comparison with fcMRI

Affiliations
Comparative Study

Measuring functional connectivity using MEG: methodology and comparison with fcMRI

Matthew J Brookes et al. Neuroimage. .

Abstract

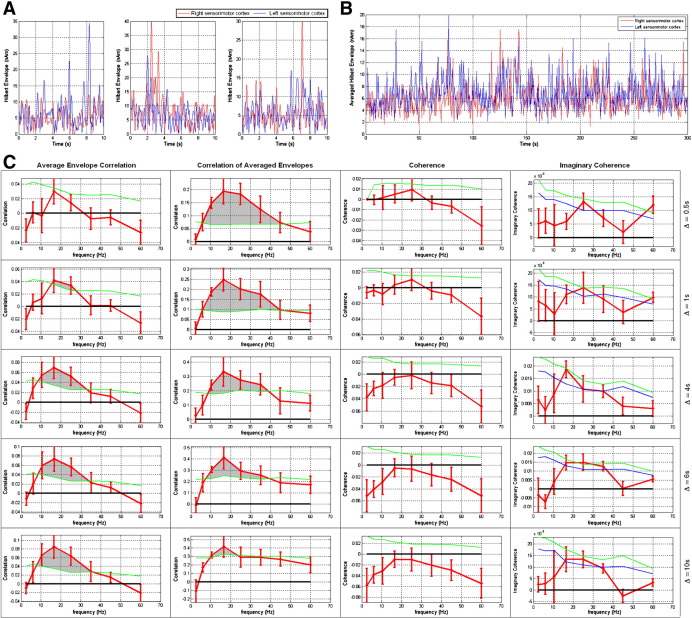
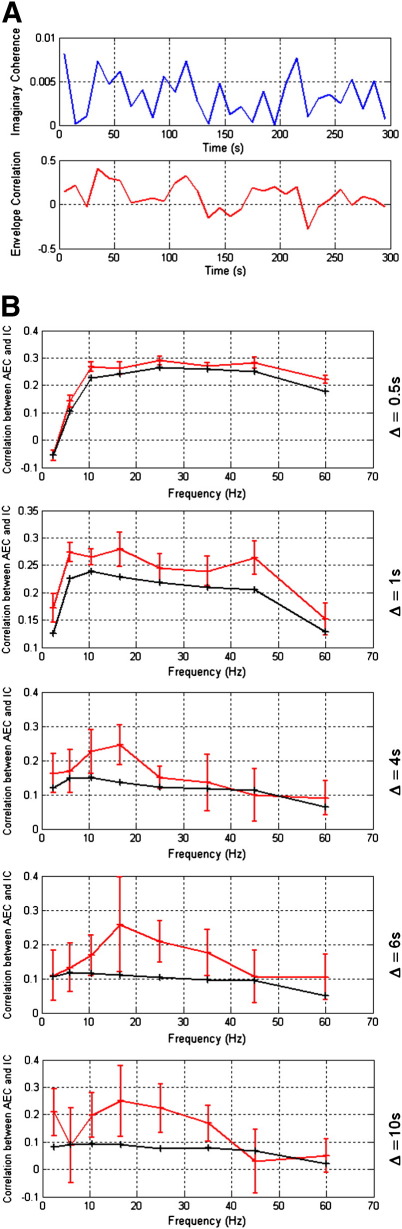
Functional connectivity (FC) between brain regions is thought to be central to the way in which the brain processes information. Abnormal connectivity is thought to be implicated in a number of diseases. The ability to study FC is therefore a key goal for neuroimaging. Functional connectivity (fc) MRI has become a popular tool to make connectivity measurements but the technique is limited by its indirect nature. A multimodal approach is therefore an attractive means to investigate the electrodynamic mechanisms underlying hemodynamic connectivity. In this paper, we investigate resting state FC using fcMRI and magnetoencephalography (MEG). In fcMRI, we exploit the advantages afforded by ultra high magnetic field. In MEG we apply envelope correlation and coherence techniques to source space projected MEG signals. We show that beamforming provides an excellent means to measure FC in source space using MEG data. However, care must be taken when interpreting these measurements since cross talk between voxels in source space can potentially lead to spurious connectivity and this must be taken into account in all studies of this type. We show good spatial agreement between FC measured independently using MEG and fcMRI; FC between sensorimotor cortices was observed using both modalities, with the best spatial agreement when MEG data are filtered into the β band. This finding helps to reduce the potential confounds associated with each modality alone: while it helps reduce the uncertainties in spatial patterns generated by MEG (brought about by the ill posed inverse problem), addition of electrodynamic metric confirms the neural basis of fcMRI measurements. Finally, we show that multiple MEG based FC metrics allow the potential to move beyond what is possible using fcMRI, and investigate the nature of electrodynamic connectivity. Our results extend those from previous studies and add weight to the argument that neural oscillations are intimately related to functional connectivity and the BOLD response.


Figures

Fig. A1
Fig. A1
Hilbert envelope power spectra derived from real and simulated BFR MEG data for all six subjects. In all cases spectra are computed in the seed location in the left primary sensorimotor area.
Fig. A2
Fig. A2
Hilbert envelope power spectra derived from real data, and simulated MEG data employing surrogate Hilbert envelopes. In all cases spectra are computed in the seed location in the left primary sensorimotor area.
Fig. A3
Fig. A3
AEC (Δ = 10 s) (top panel) and CAE (Δ = 0.5 s) (bottom panel) computed in the β band. Within each of the four quadrants the left hand plot shows the raw FC metrics computed using real (red) and simulated (blue) data. In the right hand plot the red bar shows the corrected FC metric while the blue bar shows the correlation value required to reach statistical significance. A) Simulated MEG sources based on white noise (i.e. equivalent to the main manuscript). B) Simulated MEG sources based on a surrogate Hilbert envelope as explained above.
Fig. A4
Fig. A4
Fig. A4 Lead field patterns taken from a single representative source. A) Source in the left motor cortex. B) Interfering third source midway between the left and right motor cortices. C) Source in the right motor cortex.
Fig. A5
Fig. A5
AEC (Δ = 10 s) (top panel) and CAE (Δ = 0.5 s) (bottom panel) computed in the β band. Within each of the four quadrants the left hand plot shows the raw FC metrics computed using real (red) and simulated (blue) data. In the right hand plot the red bar shows the corrected FC metric while the blue bar shows the correlation value required to reach statistical significance. A) The third source has zero amplitude (i.e. result equivalent to those in Fig. 3). B) Third source has amplitude equal to the mean of the amplitudes of the left and right motor cortex sources.
Fig. A6
Fig. A6
Rejection of cardiac interference with spatial filtering. A) The measured ECG and the magnetic field from a single MEG sensor. B) The channel space topography of cardiac interference plotted for each frequency band of interest. C) Correlation between MEG and ECG plotted as a function of frequency; the blue line shows correlation with sensors most affected by a source in left primary motor cortex; the green line shows correlation with the beamformer reconstructed timecourse for the same source in left motor cortex. D) Equivalent to (C) but shown for the right motor cortex. Notice the significant drop in ECG correlation with application of the spatial filter.
Fig. A7
Fig. A7
Fig. A7 AEC, CAE, Coh and ICoh metrics applied to real (blue curve) and simulated (black curve) data extracted from left and right motor cortices. The four columns show the four separate FC metrics and the 5 rows show different values of delta.
Fig. 1
Fig. 1
Results of the MEG and fMRI localizer experiments. A) β band power decrease in bilateral motor cortex in response to the finger movement task (single subject); B) corresponding increase in BOLD contrast in bilateral motor cortex (single subject). C) β band power decrease averaged across subjects and overlaid onto the MNI brain; D) corresponding increase in BOLD also averaged across subjects. All images are shown according to the radiological convention. Cross hairs are placed at the peak β band power decrease.
Fig. 2
Fig. 2
Signal leakage in beamformer spatial filtering: A) Correlation between lead fields at the seed location (cross hairs) and all other brain voxels (result for a single subject). B–C) Volumetric images of correlation between beamformer weights at a seed location (cross hairs) and all other test voxels in the brain. B) Weights computed using contiguous resting state and localizer data (μ = 4; 13 Hz–20 Hz band; single subject); C) weights computed using resting state data only (μ = 4; 13 Hz–20 Hz band; single subject); D) beamformer weights correlation plotted as a function of lead field correlation, highlighting the non-linear relationship between the two metrics (all frequencies; results for a single subject). E) Lead field correlation plotted as a function of distance from the seed location. F) Beamformer weights correlation (weights computed using all data; μ = 4) plotted as a function of distance from the seed location. G) Weights correlation (red) and lead field correlation (blue) between left and right motor cortices (locations identified from localizer analyses (Fig. 1)) plotted as a function of frequency (weights computed using all data; μ = 4; average and standard error across subjects shown; 13 Hz–20 Hz band).
Fig. 3
Fig. 3
Cross hemisphere connectivity measurement: A) Hilbert envelope timecourses extracted from the left (blue) and right (red) sensorimotor cortices of a single subject. The three panels show three separate (Δ = 10 s) segments that are used (alongside 27 others) in an averaged envelope correlation computation. B) Averaged Hilbert envelope timecourses (Δ = 0.5 s) extracted from the left (blue) and right (red) sensorimotor cortex of a single subject. These two timecourses are used to obtain the correlation of averaged enveloped (CAE) metric. C) Corrected AEC (Column 1), CAE (Column 2) Coh (Column 3) and ICoh (Column 4) values, plotted as a function of frequency. In all cases the red line shows the result from real data (average and standard error across subjects) while the green line shows the 95% confidence limit derived from simulations. In the case of ICoh, the blue line shows the 90% confidence limit. The five rows in Fig. 3C show results for Δ = 0.5 s, 1 s, 4 s, 6 s and 10 s respectively. Gray shading indicates statistical significance (p < 0.05) across the subject group.
Fig. 4
Fig. 4
Investigating a relationship between envelope correlation and phase coupling. A) The timecourse of FC measured using ICoh (upper panel), and AEC (lower panel) for (Δ = 10 s). B) Correlation between ICoh and AEC derived FC timecourses for Δ = 1 s, 4 s, 6 s and 10 s. Red line shows result derived using real MEG data while black line shows result from the simulations.
Fig. 5
Fig. 5
Comparison between fcMRI and fcMEG in a single subject. A) Statistically significant (p < 0.05) correlation between a BOLD timecourse at the seed in the right motor cortex, and all other voxels. B) Correlation between averaged Hilbert envelopes at the seed and all other voxels for MEG data filtered to the low β band (13 Hz–20 Hz). The green overlay shows voxels achieving statistical significance (p < 0.05). Note good agreement between the location of the peak in the left motor cortex for fcMRI and fcMEG. All images are shown according to the radiological convention.
Fig. 6
Fig. 6
Group results. A) Functional connectivity MRI results averaged across 5 subjects. B)–H) Correlation of averaged envelope results in the 1 Hz–4 Hz, 4 Hz–8 Hz, 8 Hz–13 Hz, 13 Hz–20 Hz, 20 Hz–30 Hz, 30 Hz–40 Hz and 40 Hz–70 Hz frequency bands respectively. The green overlay shows voxels in the left hemisphere exhibiting statistically significant (p = 0.05) correlation across the subject group. Notice that in the β band there is good spatial agreement between fcMEG and fcMRI results. All images are shown according to the radiological convention.
Fig. 7
Fig. 7
Quantitative comparison of fcMRI and fcMEG images. A) Spatial correlation coefficients between unthresholded fcMEG images and the unthresholded average fcMRI image as a function of frequency. Red line shows real MEG data while the blue line shows the case for fcMEG images derived using simulated data. A significant (p < 0.05) difference between these two measurements occurs in the low β frequency band. B) Spatial overlap between significant connectivity in left hemisphere identified using fcMRI and fcMEG. Note in both cases a peak in the β band.

Similar articles

Cited by

References

    1. Barnes G.R., Hillebrand A. Statistical flattening of beamformer images. Human Brain Mapping. 2003;18:1–12. - PMC - PubMed
    1. Birn R.M., Diamond J.B., Smith M.A., Bandettini P.A. Separating respiratory variation related fluctuations from neuronal activity related fluctuations in fMRI. Neuroimage. 2006;31:1536–1548. - PubMed
    1. Birn R.M., Murphy K., Bandettini P.A. The effect of respiration variations on independent component analysis results of resting state functional connectivity. Hum. Brain Mapp. 2008;29:740–750. - PMC - PubMed
    1. Biswal B., Yetkin F.Z., Haughton V.M., Hyde J.S. Functional connectivity in the motor cortex of resting human brain using echo planar MRI. Magn. Reson. Med. 1995;34:537–541. - PubMed
    1. Brookes M.J., Gibson A.M., Hall S.D., Furlong P.L., Barnes G.R., Hillebrand A., Singh K.D., Holliday I.E., Francis S.T., Morris P.G. A general linear model for MEG beamformer imaging. Neuroimage. 2004;23:936–946. - PubMed

Publication types

MeSH terms