

A Bayesian model of shape and appearance for subcortical brain segmentation
- PMID: 21352927
- PMCID: PMC3417233
- DOI: 10.1016/j.neuroimage.2011.02.046
A Bayesian model of shape and appearance for subcortical brain segmentation
Abstract
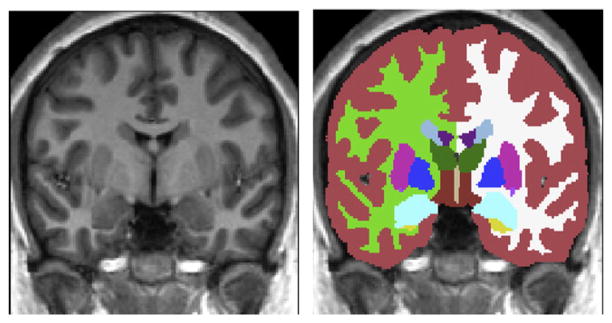
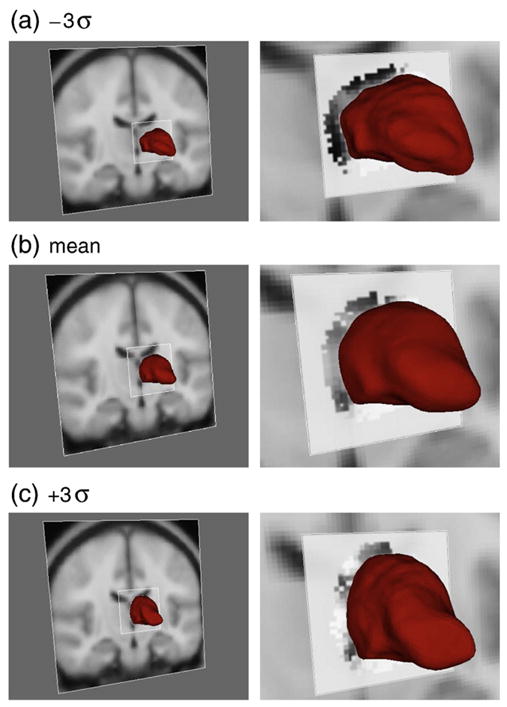
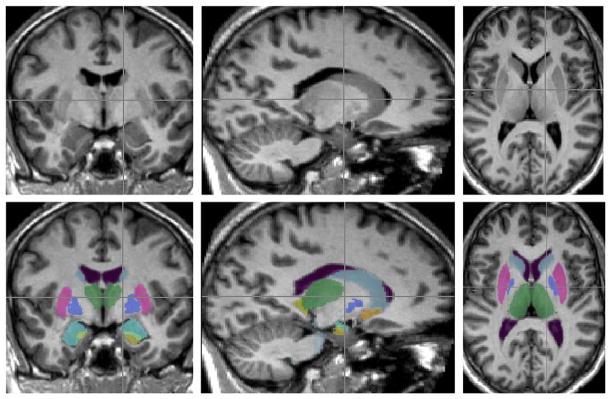
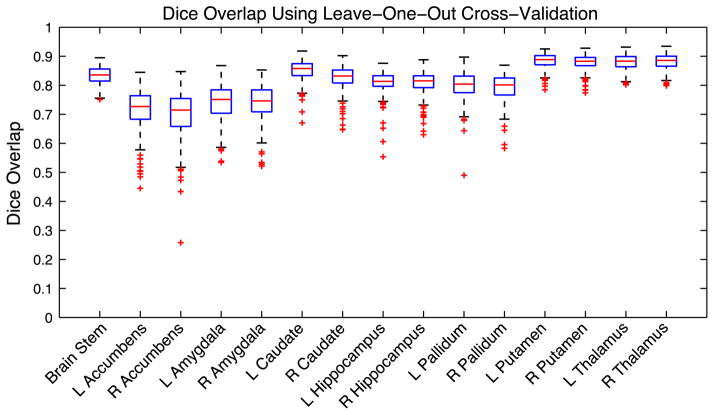
Automatic segmentation of subcortical structures in human brain MR images is an important but difficult task due to poor and variable intensity contrast. Clear, well-defined intensity features are absent in many places along typical structure boundaries and so extra information is required to achieve successful segmentation. A method is proposed here that uses manually labelled image data to provide anatomical training information. It utilises the principles of the Active Shape and Appearance Models but places them within a Bayesian framework, allowing probabilistic relationships between shape and intensity to be fully exploited. The model is trained for 15 different subcortical structures using 336 manually-labelled T1-weighted MR images. Using the Bayesian approach, conditional probabilities can be calculated easily and efficiently, avoiding technical problems of ill-conditioned covariance matrices, even with weak priors, and eliminating the need for fitting extra empirical scaling parameters, as is required in standard Active Appearance Models. Furthermore, differences in boundary vertex locations provide a direct, purely local measure of geometric change in structure between groups that, unlike voxel-based morphometry, is not dependent on tissue classification methods or arbitrary smoothing. In this paper the fully-automated segmentation method is presented and assessed both quantitatively, using Leave-One-Out testing on the 336 training images, and qualitatively, using an independent clinical dataset involving Alzheimer's disease. Median Dice overlaps between 0.7 and 0.9 are obtained with this method, which is comparable or better than other automated methods. An implementation of this method, called FIRST, is currently distributed with the freely-available FSL package.
Copyright © 2011 Elsevier Inc. All rights reserved.
Figures
References
-
- Arzhaeva Y, van Ginneken B, Tax D. Image classification from generalized image distance features: application to detection of interstitial disease in chest radiographs. Proceedings of the 18th International Conference on Pattern Recognition-Volume 01; Washington, DC, USA: IEEE Computer Society; 2006.
-
- Babalola K, Petrovic V, Cootes T, Taylor C, Twining C, Williams T, Mills A. Automatic segmentation of the caudate nuclei using active appearance models. Proceedings of the 10th International Conference on Medical Image Computing and Computer-Assisted Intervention: 3D Segmentation in the Clinic: A Grand Challenge; 2007. pp. 57–64.
-
- Babalola K, Patenaude B, Aljabar P, Schnabel J, Kennedy D, Crum W, Smith S, Cootes T, Jenkinson M, Rueckert D. Comparison and evaluation of segmentation techniques for subcortical structures in brain MRI. Proceedings of the 11th International Conference on Medical Image Computing and Computer-Assisted Intervention; Springer; 2008. pp. 409–416. - PubMed
-
- Benjamini Y, Hochberg Y. Controlling the false discovery rate: a practical and powerful approach to multiple testing. R Stat Soc B. 1995;57:289–300.
Publication types
MeSH terms
Grants and funding
- R01 DA017905/DA/NIDA NIH HHS/United States
- K01 MH01798/MH/NIMH NIH HHS/United States
- P41-RR14075/RR/NCRR NIH HHS/United States
- R01 NS052585-01/NS/NINDS NIH HHS/United States
- K01 MH001798/MH/NIMH NIH HHS/United States
- K08 MH01573/MH/NIMH NIH HHS/United States
- R01 NS052585/NS/NINDS NIH HHS/United States
- R01 MH083320/MH/NIMH NIH HHS/United States
- R01 RR16594-01A1/RR/NCRR NIH HHS/United States
- R01 RR016594/RR/NCRR NIH HHS/United States
- BB/C519938/1/BB_/Biotechnology and Biological Sciences Research Council/United Kingdom
- P41 RR014075/RR/NCRR NIH HHS/United States
- P30 HD004147/HD/NICHD NIH HHS/United States
LinkOut - more resources
Full Text Sources
Other Literature Sources
Medical
