Comparative Study
. 2011 Apr 5;29(16):3008-20.
doi: 10.1016/j.vaccine.2011.01.106. Epub 2011 Feb 23.

A comparative analysis of HIV-specific mucosal/systemic T cell immunity and avidity following rDNA/rFPV and poxvirus-poxvirus prime boost immunisations

Affiliations
Comparative Study

A comparative analysis of HIV-specific mucosal/systemic T cell immunity and avidity following rDNA/rFPV and poxvirus-poxvirus prime boost immunisations

Charani Ranasinghe et al. Vaccine. .

Abstract

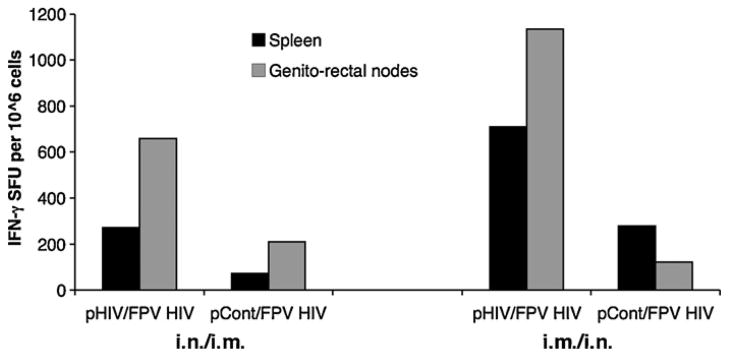
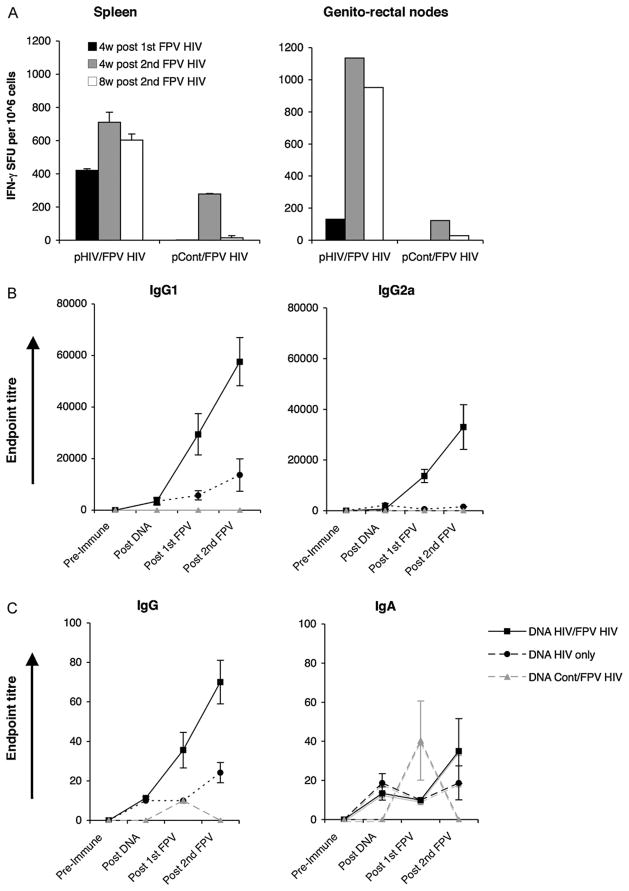
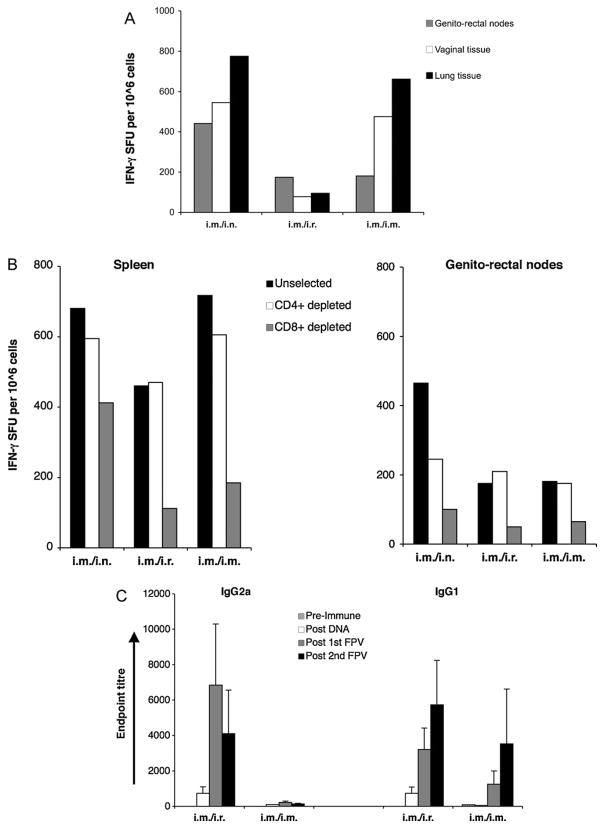
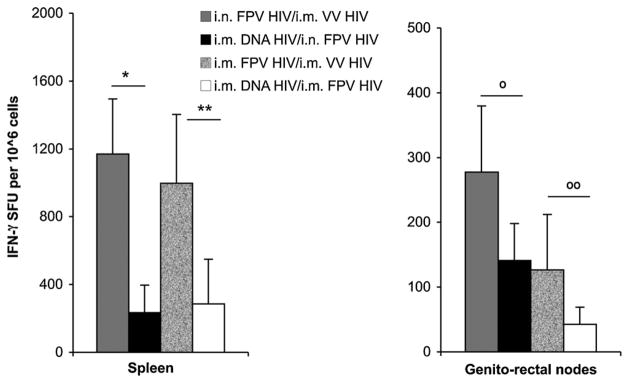
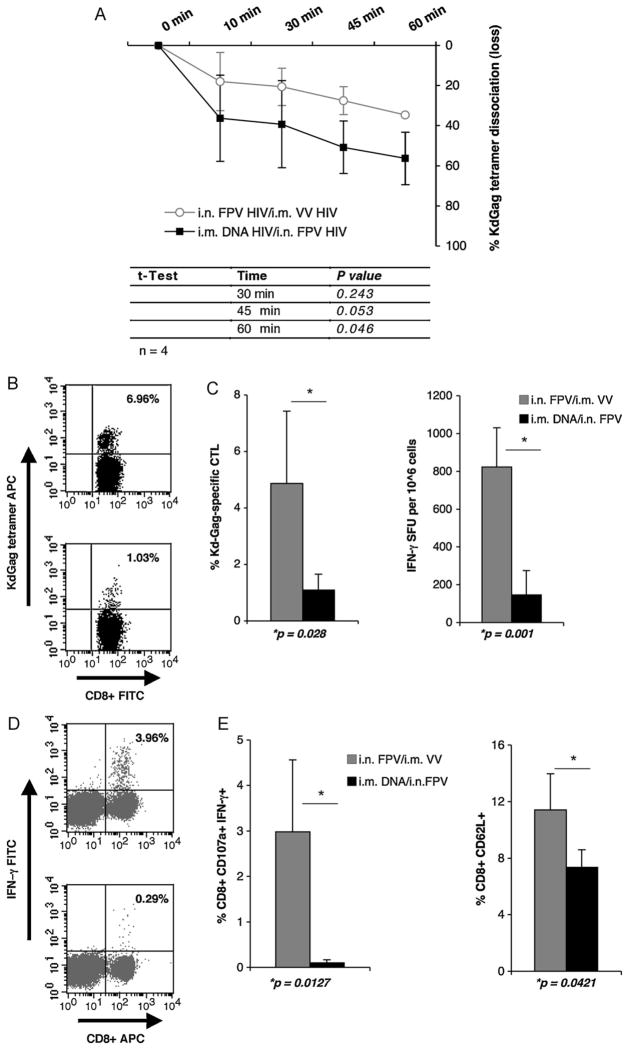
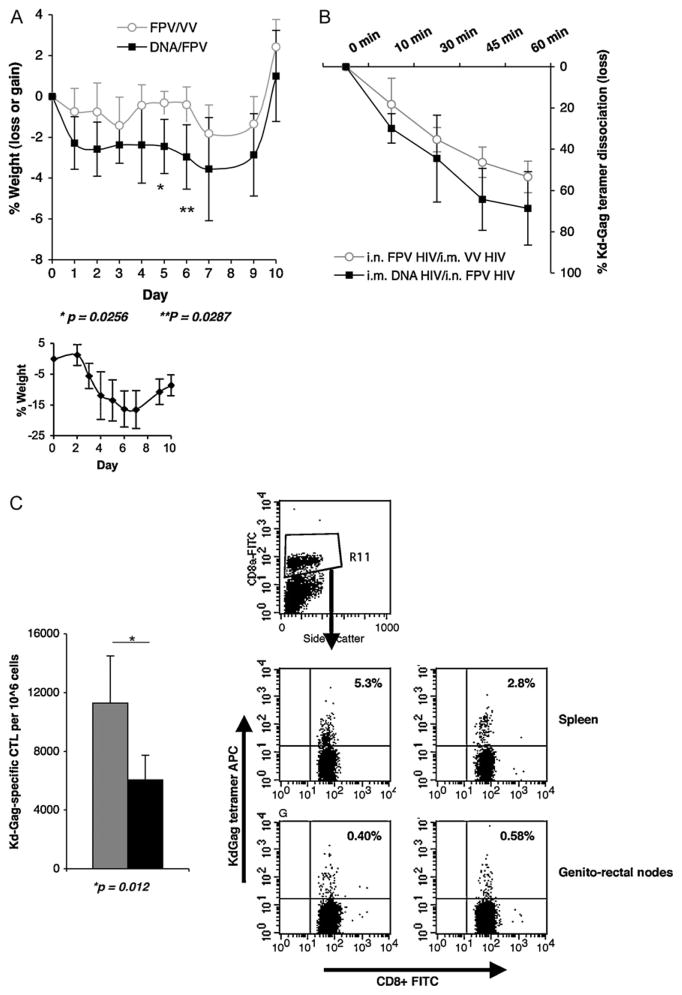
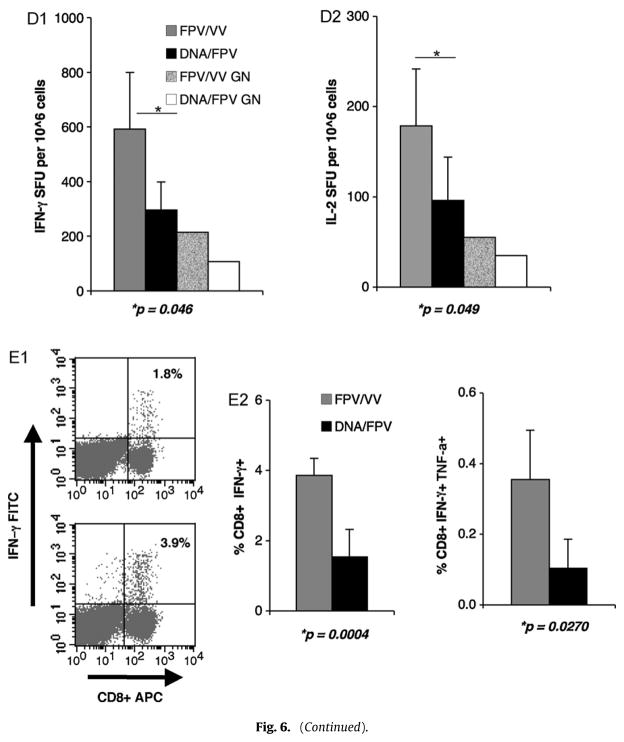
In this study we have firstly compared a range of recombinant DNA poxvirus prime-boost immunisation strategies and shown that combined intramuscular (i.m.) 2× DNA-HIV/intranasal (i.n.) 2× FPV-HIV prime-boost immunisation can generate high-level of HIV-specific systemic (spleen) and mucosal (genito-rectal nodes, vaginal tissues and lung tissues) T cell responses and HIV-1 p24 Gag-specific serum IgG1, IgG2a and mucosal IgG, SIgA responses in vaginal secretions in BALB/c mice. Data indicate that following rDNA priming, two rFPV booster immunisations were necessary to generate good antibody and mucosal T cell immunity. This data also revealed that mucosal uptake of recombinant fowl pox (rFPV) was far superior to plasmid DNA. To further evaluate CD8+ T cell immunity, i.m. 2× DNA-HIV/i.n. 1× FPV-HIV immunisation strategy was directly compared with single shot poxvirus/poxvirus, i.n. FPV-HIV/i.m. VV-HIV immunisation. Results indicate that the latter strategy was able to generate strong sustained HIV-specific CD8+ T cells with higher avidity, broader cytokine/chemokine profiles and better protection following influenza-K(d)Gag(197-205) challenge compared to rDNA poxvirus prime-boost strategy. Our findings further substantiate the importance of vector selection/combination, order and route of delivery when designing effective vaccines for HIV-1.


Figures

Fig. 1
Fig. 1
Route specific T cell immunity following 2× rDNA/2× rFPV prime-boost immunisation. Mice n = 4–5 per group were immunised i.n. with 50 μg of 2× DNA-HIV or 2× DNA-control complexed with lipofectamine and i.m. with 5 ×10⁶ pfu FPV-HIV (left) or i.m. 2×DNA-HIV or 2×DNA-control prime (without lipofectamine) followed by i.n. FPV-HIV boost (right), These immunisations were performed 4 weeks apart as indicated in Table 2 (groups 1–4). At 4 weeks after the final boost, spleen (black bars) and genito-rectal node (grey bars) cells were stimulated with the 15-mer Gag peptide pool as in Section 2 and T cell responses were measured by IFN-γ ELIspot. Unstimulated cells from each sample were used as background controls and this value was subtracted from each sample before plotting the data. The data represent pooled values, and are representative of three experiments.
Fig. 2
Fig. 2
(A–C) Mucosal and systemic T cell and B cell responses following i.m. 2× DNA-HIV/i.n. 2× FPV-HIV prime-boost immunisation. Fig. 2A. Mice n = 4–5 per group were primed i.m. with 50 μg of 2×DNA-HIV and boosted i.n. with 5 ×10⁶ pfu 2×FPV-HIV (left) or i.m. 2×DNA-control/i.n. 2×FPV-HIV, 4 weeks apart as indicated in Table 2 (groups 3 and 4). Mice were sacrificed at 4 weeks post 1st FPV-HIV boost (black), or at 4 (grey) or 8 (white) weeks post 2nd FPV-HIV boost respectively. Spleen (left) and genito-rectal node (right) cells were stimulated with 15-mer Gag peptide pool as indicated in Section 2 and T cell responses were measured by IFN-γ ELIspot. Unstimulated cells from each sample were used as background controls and were subtracted from each sample before plotting the data. The data represent pooled values, and are representative of three experiments. (B and C) Mice n = 15 per group were prime-boost immunised as indicated in Table 2 (groups 3–5). HIV-1 p24 Gag-specific serum IgG1 and IgG2A (B), and mucosal IgG and IgA (C) antibody responses were measured at pre-immunisation, at 4 weeks post 2nd DNA, at 4 weeks post 1st FPV-HIV and at 2nd FPV-HIV boost respectively. Control positive and negative sera were used in these assays. Y-axis shows endpoint titres calculated as in Section 2. The data represent mean ±SEM for 15 individual mice.
Fig. 3
Fig. 3
(A) Mucosal memory T cell responses following different routes of FPV-HIV boosting. Mice (n = 10–15 per group) were primed i.m. with 50 μg of 2× DNA HIV and boosted i.n., i.r. or i.m. with 5 ×10⁶ pfu 2× FPV-HIV 4 weeks later, as indicated in Table 2 (groups 3,6 and 7). Mice were sacrificed 7–8 weeks after the 2nd FPV-HIV boost and genito-rectal nodes (grey), vaginal tissues (white) and lung tissues (black) were harvested and single cell suspensions prepared as indicated in Section 2. Cells were stimulated with the 15-mer Gag peptide pool and T cell responses were measured by IFN-γ ELIspot. Unstimulated cells from each sample were used as background controls and were subtracted from each sample before plotting the data. The data represent pooled values, and are representative of two or three experiments. (B) CD4+ and CD8+ T cell responses following three 2× DNA-HIV/2× FPV-HIV immunisation strategies. Mice (n = 10–15 per group) were primed i.m. with 50 μg of 2× DNA-HIV and boosted i.n., i.r. or i.m. with 5 ×10⁶ pfu 2× FPV-HIV 4 weeks apart as indicated in Table 2 (groups 3,6 and 7). Mice were sacrificed 7–8 weeks post-2nd FPV-HIV boost and spleen (left) and genito-rectal nodes (right) were harvested, single cell suspensions prepared, and CD4+ and CD8+ depletions performed using positive selection, as indicated in Section 2. Cells were stimulated with 15-mer Gag peptide pool and T cell responses were measured by IFN-γ ELIspot. Unselected cells (black) were compared with CD4+-depleted (white) and CD8+-depleted (grey) samples. Unstimulated cell responses from each sample were used as background controls and were subtracted from each sample before plotting the data (these ELIspot values were less than 25 SFU). The data represent pooled values, and are representative of two experiments. (C) Serum antibody responses following i.m. 2× DNA-HIV prime i.r or i.m 2× FPV-HIV boost immunisation. Mice (n = 10–15 per group) were primed i.m. with 50 μg of 2× DNA-HIV and boosted i.r or i.m. with 5 ×10⁶ pfu 2× FPV-HIV 4 weeks apart as indicated in Table 2 (groups 6 and 7). HIV-1 p24 Gag-specific serum IgG1 (right) and IgG2A (left) antibody responses were measured pre-immunisation (striped), and at 4 weeks post-2nd DNA (white), 4 weeks post-1st FPV-HIV (grey) and 4 weeks post-2nd FPV HIV (black) boost. Control positive and negative sera were used in these assays. Y-axis shows endpoint titres calculated as in Section 2. The data represent mean ±SEM of 15 individual mice.
Fig. 4
Fig. 4
CD8+ T cell responses generated by 2× DNA-HIV/FPV-HIV and to FPV-HIV/VV-HIV immunisation strategies. Mice were: (a) primed i.m. with 100 μg of 2× DNA-HIV and boosted i.n. or i.m. with 1 ×10⁷ pfu FPV-HIV, or (b) primed i.n. or i.m. with 1 ×10⁷ pfu FPV-HIV and boosted with 1 ×10⁷ pfu VV-HIV at 2-week intervals as indicated in Table 2 (groups 8–11). Mice were sacrificed 2 weeks post-boosting and spleen (left) and genito-rectal lymph nodes (right) cells were stimulated with immunodominant H-2Kd-binding AMQMLKETI Gag peptide. CD8+ T cell responses were measured by IFN-γ ELIspot. Unstimulated cells from each sample served as background controls and were subtracted from each sample before plotting the data. The data represent mean ±SD for 3–4 experiments (total n = 12 mice/group). Spleen samples *p = 0.005, **p = 0.038 and genito-rectal node samples °p = 0.078,°°p = 0.141 as determined using the Student’s t-test.
Fig. 5
Fig. 5
(A) KdGag197–205-specific avidity of cost T cells generated following rDNA and pox-virus prime-boost immunisation. Mice were immunised: (a) i.m. 2× DNA-HIV/i.n. FPV-HIV (black line) or (b) i.n. FPV-HIV/i.m. VV-HIV (grey line) at 2 weeks intervals as indicated in Table 2 (groups 9 and 10). At 14 days following boosting, percentages of KdGag197–205 positive CD8+ T splenocyte dissociation were measured as described in Section 2. The data represent mean ± SD obtained with 4 mice per group. Tetramer loss p values were calculated at 30 min, 45 min and the 60 min time points using two-tailed, two-sample equal variance Student’s t-test and are shown in the bottom panel. The data are representative of at least three experiments. (B–E) HIV-specific effector CD8+ T cell responses following rDNA and poxvirus prime-boost immunisation. Mice were immunised i.m. 2×DNA-HIV/i.n. FPV-HIV (grey) or i.n. FPV-HIV/i.m. VV-HIV (black) at 2 weeks intervals as indicated in Table 2 (groups 9 and 10). 14 days later, KdGag197–205-specific effector T cell responses were measured by (B) tetramer staining (p = 0.028), (C) IFN-γ ELIspot (p = 0.001), (D) ICS of CD107a and IFN-γ (p = 0.0127), and (E) CD8α, CD62L staining (p = 0.0421) as described in Section 2. Representative FACS plots 5B and D, top indicate FPV-HIV/VV-HIV, bottom 2×DNA-HIV/FPV-HIV. All plots upper right quadrants indicate the percentage of tetramer reactive CD8+ T cells (5B) and percentage of CD8+ expressing IFN-γ (5D). Data represent mean +SD of 4 mice per group and p values were determined using two-tailed, two sample equal variance Student’s t-test. When plotting ELIspot and flow cytometry data (C–E), unstimulated cell responses from each sample were used as background controls and these values were subtracted from each sample (ELIspot values were less than 25 SFU). The data are representative of three experiments.
Fig. 6
Fig. 6
(A and B) Protective immunity and CTL avidity following PR8-KdGag197–205 challenge. BALB/c mice were immunised i.m. 2× DNA-HIV/i.n. FPV-HIV (grey line) or i.n. FPV-HIV/i.m. VV-HIV (black line) as indicated in Table 2 (groups 9 and 10). 6 weeks post-booster immunisation (top) or unimmunised (bottom) mice were challenged mucosally (i.n.) with 50 units influenza virus PR8 expressing KdGag197–205 epitope. (A) Body weight was monitored for 10 days and (B) avidity of KdGag197–205-specific T cells in spleen was also measured at 10 days following recovery, by tetramer dissociation assay, as described in Section 2. The data represent mean ±SD obtained with 5 mice per group and p values are calculated using two-tailed, two sample equal variance Student’s t-test. The data are representative of three experiments. (C–E) Memory CD8+ T cell responses following PR8-KdGag197–205 challenge. BALB/c mice were immunised i.m. 2× DNA-HIV/i.n. FPV-HIV (grey) or i.n. FPV-HIV/i.m. VV-HIV (black) as indicated in Table 2 (groups 9 and 10). 6 weeks after the booster immunisation, mice were challenged mucosally (i.n.) with 50 units influenza virus PR8 expressing the KdGag197–205 epitope. Following PR8-KdGag197–205 challenge, memory CD8+ T cell responses were measured by (C) KdGag197–205 tetramer staining (p = 0.012), (D1) IFN-γ ELIspot (p = 0.046), (D2) IL-2 ELIspot (p = 0.046), (E1) CD8+ IFN-γ+ ICS (p = 0.0004) and (E2) CD8+ IFN-γ+ TNF-α+ ICS (p = 0.0270) as described in Section 2. (C) KdGag197–205 tetramer staining data are represented as total number of KdGag197–205-specific CTL per 106 splenocytes and FACS plots (C) upper quadrants represent the percentage of CD8+ that are tetramer reactive, measured in spleen and genito-rectal nodes. IFN-γ ICS representative FACS plots (E1), top indicates 2× DNA-HIV/FPV-HIV and bottom FPV-HIV/VV-HIV, the upper right quadrant indicates the percentage CD8+ expressing IFN-γ. When plotting ELIspot and flow cytometry data, unstimulated cells from each sample were used as the background control and this value was subtracted from each sample. Data represent mean +SD of 5 mice per group and p values were determined using two-tailed, two sample equal variance Student’s t-test. The data are representative of three experiments.
Fig. 6
Fig. 6
(A and B) Protective immunity and CTL avidity following PR8-KdGag197–205 challenge. BALB/c mice were immunised i.m. 2× DNA-HIV/i.n. FPV-HIV (grey line) or i.n. FPV-HIV/i.m. VV-HIV (black line) as indicated in Table 2 (groups 9 and 10). 6 weeks post-booster immunisation (top) or unimmunised (bottom) mice were challenged mucosally (i.n.) with 50 units influenza virus PR8 expressing KdGag197–205 epitope. (A) Body weight was monitored for 10 days and (B) avidity of KdGag197–205-specific T cells in spleen was also measured at 10 days following recovery, by tetramer dissociation assay, as described in Section 2. The data represent mean ±SD obtained with 5 mice per group and p values are calculated using two-tailed, two sample equal variance Student’s t-test. The data are representative of three experiments. (C–E) Memory CD8+ T cell responses following PR8-KdGag197–205 challenge. BALB/c mice were immunised i.m. 2× DNA-HIV/i.n. FPV-HIV (grey) or i.n. FPV-HIV/i.m. VV-HIV (black) as indicated in Table 2 (groups 9 and 10). 6 weeks after the booster immunisation, mice were challenged mucosally (i.n.) with 50 units influenza virus PR8 expressing the KdGag197–205 epitope. Following PR8-KdGag197–205 challenge, memory CD8+ T cell responses were measured by (C) KdGag197–205 tetramer staining (p = 0.012), (D1) IFN-γ ELIspot (p = 0.046), (D2) IL-2 ELIspot (p = 0.046), (E1) CD8+ IFN-γ+ ICS (p = 0.0004) and (E2) CD8+ IFN-γ+ TNF-α+ ICS (p = 0.0270) as described in Section 2. (C) KdGag197–205 tetramer staining data are represented as total number of KdGag197–205-specific CTL per 106 splenocytes and FACS plots (C) upper quadrants represent the percentage of CD8+ that are tetramer reactive, measured in spleen and genito-rectal nodes. IFN-γ ICS representative FACS plots (E1), top indicates 2× DNA-HIV/FPV-HIV and bottom FPV-HIV/VV-HIV, the upper right quadrant indicates the percentage CD8+ expressing IFN-γ. When plotting ELIspot and flow cytometry data, unstimulated cells from each sample were used as the background control and this value was subtracted from each sample. Data represent mean +SD of 5 mice per group and p values were determined using two-tailed, two sample equal variance Student’s t-test. The data are representative of three experiments.

Similar articles

Cited by

References

    1. Kelleher AD, Puls RL, Bebbington M, Boyle D, Ffrench R, Kent SJ, et al. A randomised, placebo-controlled phase I trial of DNA prime, recombinant fowlpox virus boost prophylactic vaccine for HIV-1. AIDS. 2006;20(2):294–7. - PubMed
    1. Sekaly RP. The failed HIV Merck vaccine study: a step back or a launching point for future vaccine development? J Exp Med. 2008;205(1):7–12. - PMC - PubMed
    1. Kaul R, Plummer FA, Kimani J, Dong T, Kiama P, Rostron T, et al. HIV-1-specific mucosal CD8+ lymphocyte responses in the cervix of HIV-1-resistant prostitutes in Nairobi. J Immunol. 2000;164:1602–11. - PubMed
    1. Kozlowski PA, Neutra MR. The role of mucosal immunity in prevention of HIV transmission. Curr Mol Med. 2003;3(3):217–28. - PubMed
    1. Stevceva L, Strober W. Mucosal HIV vaccines: where are we now? Curr HIV Res. 2004;2(1):1–10. - PubMed

Publication types

MeSH terms