. 2011 Mar 8;21(5):369-76.
doi: 10.1016/j.cub.2011.01.067. Epub 2011 Feb 25.

Kinetic analysis reveals the fate of a microRNA following target regulation in mammalian cells

Affiliations

Kinetic analysis reveals the fate of a microRNA following target regulation in mammalian cells

Alessia Baccarini et al. Curr Biol. .

Abstract

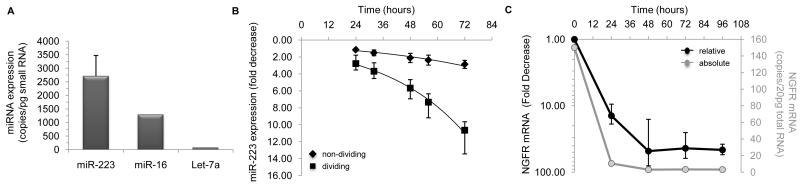
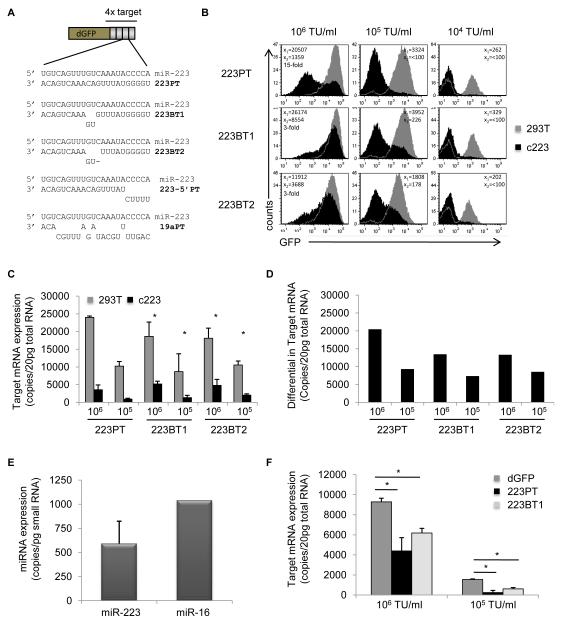
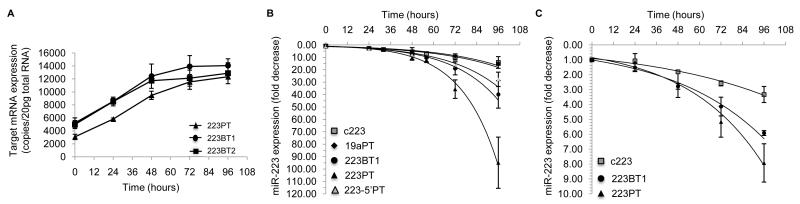
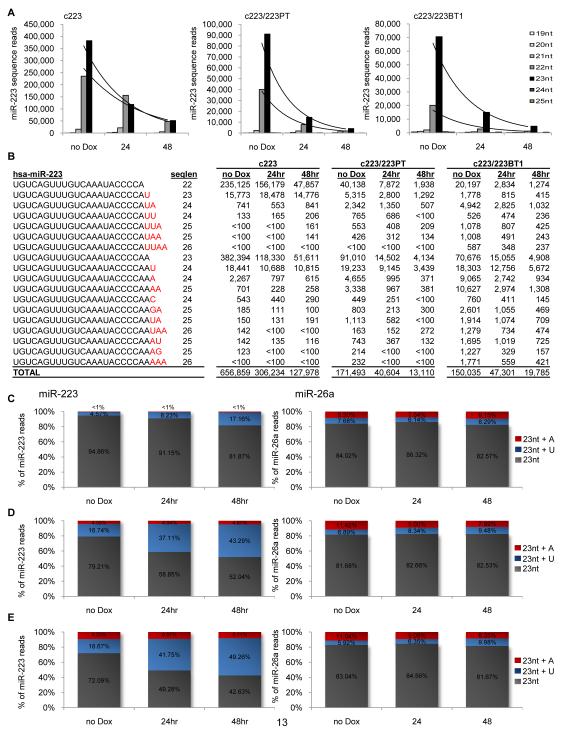
Considerable details about microRNA (miRNA) biogenesis and regulation have been uncovered, but little is known about the fate of the miRNA subsequent to target regulation. To gain insight into this process, we carried out kinetic analysis of a miRNA's turnover following termination of its biogenesis and during regulation of a target that is not subject to Ago2-mediated catalytic cleavage. By quantitating the number of molecules of the miRNA and its target in steady state and in the course of its decay, we found that each miRNA molecule was able to regulate at least two target transcripts, providing in vivo evidence that the miRNA is not irreversibly sequestered with its target and that the nonslicing pathway of miRNA regulation is multiple-turnover. Using deep sequencing, we further show that miRNA recycling is limited by target regulation, which promotes posttranscriptional modifications to the 3' end of the miRNA and accelerates the miRNA's rate of decay. These studies provide new insight into the efficiency of miRNA regulation that help to explain how a miRNA can regulate a vast number of transcripts and that identify one of the mechanisms that impart specificity to miRNA decay in mammalian cells.


Figures

Figure 1
Figure 1. Monitoring the kinetics of miRNA decay in mammalian cells
(A) Absolute level of miR-223 expression in c223 cells (n=40). To derive the absolute levels of expression, a standard curve was generated using synthetic miR-223 RNA oligonucleotides corresponding to the 22 and 23 nucleotide forms of miR-223, and CT values were extrapolated from the curve. Note that 1 pg of small RNA is approximately the amount of small RNA in a single cell. The level of miR-16 and Let-7a expression is derived from their expression relative to miR-223, as determined by qPCR. (B) Analysis of miR-223 decay in dividing (square) and non-dividing (diamond) c223 cells at the indicated time point after addition of Dox. Each value is the mean±SD (n=4). (C) The kinetics of NGFR RNA decay was monitored by treating c223 cells with Dox, and measuring the decrease in NGFR transcripts by qPCR (black, left axis). A standard curve for NGFR was generated, and the absolute levels of NGFR mRNA were extrapolated from the curve (gray, right axis). Values are the mean±SD (n=3). For additional related data see Figure S1.
Figure 2
Figure 2. Quantification of miR-223-mediated protein and RNA suppression in c223 cells
(A) Schematic of the sequences of the targets used, and their respective pairing to mature miR-223. Each vector contained 4 copies of the indicated target site. (B) Comparison of miR-223 target expression between 293T (gray) and c223 (black) cells. GFP expression was analyzed by FACS. Representative histograms are shown from 3 independent transductions. The mean florescence intensity of GFP in 293T and c223 cells is indicated by x1 and x2, respectively. (C) Quantitation of target mRNA expression in 293T and c223 cells. GFP mRNA was quantitated by qPCR from the indicated cells, and the absolute value was extrapolated from a standard curve generated using in vitro transcribed GFP RNA. Values are the mean±SD (n=3). (D) Absolute differential in target mRNA transcripts between 293T and c223 cells. The average concentration of GFP mRNA in c223 cells was subtracted from the average concentration of GFP mRNA in 293T cells from (C). (E) miR-223 expression in human THP-1 monocytic cells. miR-223 was measured in THP-1 cells by qPCR, and compared against a standard curve. Values are the mean±SD (n=6). miR-16 expression is derived from its value relative to miR-223. (F) Quantitation of target mRNA expression in THP-1 cells stably expressing the indicated target. Values are the mean±SD (n=3). *P< 0.005 unpaired t-test. For additional related data see Figure S2.
Figure 3
Figure 3. Evaluating the dynamics of target regulation and miR-223 decay
(A) Kinetics of target mRNA de-repression during miR-223 decay. The quantity of GFP mRNA was determined by qPCR at each time point after Dox. Values are the mean±SD (n=3). (B) Analysis of miR-223 decay in target expressing c223 cells. Cells stably expressing the indicated target were treated with Dox, and miR-223 expression was monitored at the indicated times. Each value is the mean±SD (n=≥4). (C) Analysis of miR-223 decay in non-dividing, target expressing c223 cells. One day after treatment with mitomycin C, cells were treated with Dox, and miR-223 expression was monitored. Each value is the mean±SD (n=3). For additional related data see Figure S3.
Figure 4
Figure 4. Enumerating miR-223 isoforms during decay and following target regulation
The small RNA fraction of c223 cells, and c223 cells stably expressing either the perfect target (c223/dGFP.223PT) or bulge target (c223/dGFP.223BT1) in steady-state (no Dox), and 24 and 48 hours after the addition of Dox were deep-sequenced to identify and quantitate miR-223 isoforms. (A) Comparison of miR-223 isoforms during decay in the indicated cells. Sequence reads mapping to the miR-223 gene with lengths varying from 19 – 25 nucleotides starting from the 5′ end of the miRNA were quantitated and graphed. An exponential curve is plotted in black. (B) Sequence and abundance of miR-223 isoforms in the indicated cells. Highlighted in red are non-templated nucleotides. (C-E) Relative contribution of mature miR-223 (5′- UGUCAGUUUGUCAAAUACCCCAA-3′) to adenylated (+A) and uridylated (+U) forms of miR-223 during decay in c223 cells (C) or c223 cells ovexpressing the perfect (D) or bulge target (E) to miR-223. The percent contribution of each isoform to the total is shown on the graph. As a comparison, a similar analysis was performed for miR-26a from the same samples (right). miR-26a was selected as a control because the summed reads were the most similar to miR-223, and unambiguous addition of a uridine or adenine on the most abundant isoform could be discerned. The total number of reads mapping to miRNAs were used to normalize all the data. For additional related data see Figure S4.

Comment in

  • Small RNAs: Recycling for silencing.
    Muers M. Muers M. Nat Rev Genet. 2011 Apr;12(4):227. doi: 10.1038/nrg2977. Epub 2011 Mar 15. Nat Rev Genet. 2011. PMID: 21403677 No abstract available.

Similar articles

Cited by

References

    1. Kai ZS, Pasquinelli AE. MicroRNA assassins: factors that regulate the disappearance of miRNAs. Nat Struct Mol Biol. 2010;17:5–10. - PMC - PubMed
    1. Krol J, Busskamp V, Markiewicz I, Stadler MB, Ribi S, et al. Characterizing light-regulated retinal microRNAs reveals rapid turnover as a common property of neuronal microRNAs. Cell. 2010;141:618–631. - PubMed
    1. Chatterjee S, Grosshans H. Active turnover modulates mature microRNA activity in Caenorhabditis elegans. Nature. 2009;461:546–549. - PubMed
    1. Bail S, Swerdel M, Liu H, Jiao X, Goff LA, et al. Differential regulation of microRNA stability. Rna. 2010;16:1032–1039. - PMC - PubMed
    1. Elbashir SM, Martinez J, Patkaniowska A, Lendeckel W, Tuschl T. Functional anatomy of siRNAs for mediating efficient RNAi in Drosophila melanogaster embryo lysate. Embo J. 2001;20:6877–6888. - PMC - PubMed

Publication types

LinkOut - more resources