. 2011 May 1;74(5):716-27.
doi: 10.1016/j.jprot.2011.02.018. Epub 2011 Feb 24.

Proteomic changes in the heart of diet-induced pre-diabetic mice

Affiliations

Proteomic changes in the heart of diet-induced pre-diabetic mice

Diana Cruz-Topete et al. J Proteomics. .

Abstract

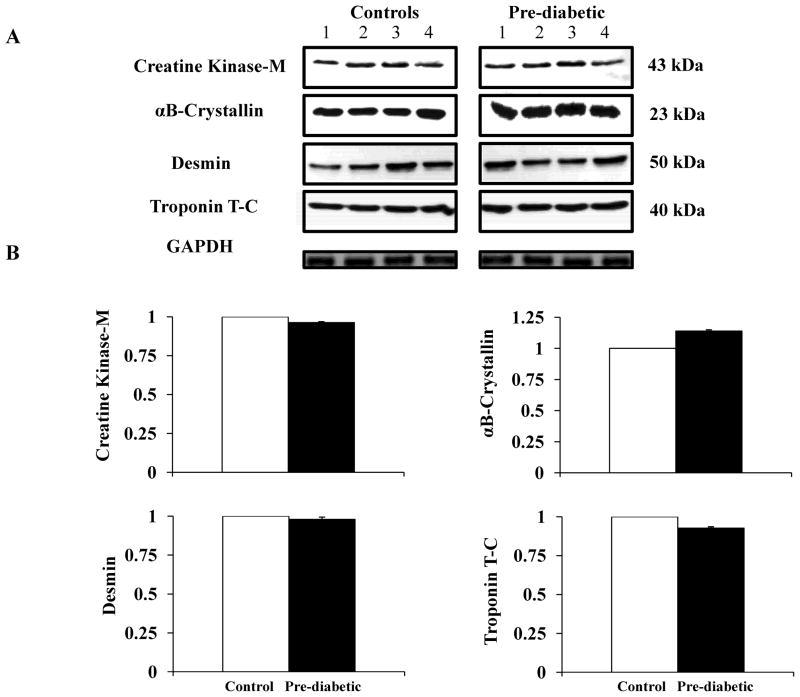
The development of type 2 diabetes (T2D) is strongly associated with obesity. In humans, T2D increases the risk for end organ complications. Among these, heart disease has been ranked as the leading cause of death. We used a proteomic methodology to test the hypothesis that a pre-diabetic state generated by high-fat diet leads to changes in proteins related to heart function and structure. Over 300 protein spots were resolved by two-dimensional gel electrophoresis (2-DE). Fifteen protein spots were found to be altered (7 decreased and 8 increased) in pre-diabetic hearts. The protein spots were then identified by mass spectrometry and immunoblots. Among the decreased proteins, 3 are involved in heart structure (one isoform of desmin, troponin T2 and α-cardiac actin), 3 are involved in energy metabolism (mitochondrial ATP synthase β subunit, adenylate kinase and creatine kinase) and one is a component of the citric acid cycle (isocitrate dehydrogenase 3). In contrast, proteins involved in fatty acid oxidation (two isoforms of peroxisomal enoyl-CoA hydratase) and the citric acid cycle (three isoforms of malate dehydrogenase) were increased in pre-diabetic hearts. The results suggest that changes in the levels of several heart proteins may have implications in the development of the cardiac phenotype associated to T2D.


Figures

Figure 1
Figure 1
Effects on high-fat diet on body weight, glucose and insulin levels. (A–C) Solid lines (−) represent controls fed on standard chow diet (n=20). Dashed lines (--) represent mice fed on high-fat diet (n=48). A) Body weight was measured every 2 weeks. The zero time-point represents 21 days of age, when the high-fat diet was initiated. The 2, 4, 8, and 16 weeks time points represent 5, 7, 11 and 19 week of age, respectively. B) Blood glucose levels were taken at 2, 4, 8, and 16 weeks on the diet. Glucose was significantly increased after 2 weeks on high-fat diet as compared to controls, and remained significantly elevated throughout the study. C) Plasma insulin levels significantly increased over time with significant differences at 8 and 16 weeks. Body weight, glucose and insulin levels in the C57BL/6J mice used for heart proteomic profiling. (D–F) White bars represent control mice fed standard chow (n=5); black bars represent mice fed on high-fat diet (n=5). This group was designated as pre-diabetic. D) Body weight. E) Blood glucose levels F) Plasma insulin levels. Errors bars represent the SEM. Statistical analysis was performed using one way ANOVA and Student’s t-test * P<0.05.
Figure 2
Figure 2
I) Representative 2-D gel of heart proteins. Proteins whose level was altered were labeled A–O and indicated by arrows. II) Representative 3D view of protein spots displaying altered levels in pre-diabetic mice as compared to controls. A) Protein spots displaying lower levels in pre-diabetic hearts (A, B, D–G and I). B) Protein spots displaying higher levels in pre-diabetic hearts (C, H, J–O). The identities of these protein spots are listed in Table 1 and Table 2. The images were generated using PDQuest software version 8.0. The 3D view images were generated based on one representative gel, but they do not represent the average spot intensity change of all the samples. The spot intensity data was converted to topographical peaks and valleys.
Figure 3
Figure 3
Western blot analysis of the levels of creatine kinase and structural proteins in heart tissues. A) Western blots to detect creatine kinase, αB-crystallin, desmin and troponin T-C in whole heart homogenates from controls (n=4) (left panel) and pre-diabetic mice (n=4) (right panel). Equal amounts of total protein were loaded (50 μg) and resolved by SDS-PAGE. B) Quantification of immunoblots was obtained using Quantity One Program Software (BioRad). Protein intensity is expressed as arbitrary units relative to controls. Glyceraldehyde 3-Phosphate Dehydrogenase (GAPDH) was used as loading control. The error bars indicate ± SEM.
Figure 4
Figure 4
Isoforms observable in 2-D western blots. 150 μg of total protein from heart extracts was resolved in the 1st dimension in a linear pH-range of 3–17 and in 15% acrylamide in the 2nd dimension. A) Representative Western blot images showing the location (~MWs and ~pIs) of the different isoforms of (I) creatine kinase (1–8), (II) αB-crystallin (1–4), (III) desmin and (IV) troponin T-C (1–5). The approximate MWs and pIs are shown in italics and bold numbers. Molecular weight markers are indicated to the left of the panels and pH gradient markers are indicated above. The dotted grids were added to facilitate the localization of the protein isoforms. B) The protein isoforms that were detected in our proteomic analysis are indicated by dashed squares. (I) Creatine kinase isoforms (1–8); (II) αB-crystallin isoforms; (III) desmin isoforms (1–13); (IV) troponin isoforms (1–5). C) Intensity values (mean ± SEM) for each protein isoform of creatine kinase(I), αB-crystallin (II), desmin (III) and troponin (IV). Quantification of immunoblots was obtained using PDQuest software version 8.0 (BioRad). White bars represent control hearts (n=4); black bars represent pre-diabetic hearts (n=4). Errors bars represent the SEM. Statistical analysis was performed using Student’s t-test * P<0.05.

Similar articles

Cited by

References

    1. Mokdad AH, Marks JS, Stroup DF, Gerberding JL. Actual causes of death in the United States, 2000. Jama. 2004;291:1238–45. - PubMed
    1. Engelgau MM, Geiss LS, Saaddine JB, Boyle JP, Benjamin SM, Gregg EW, et al. The evolving diabetes burden in the United States. Ann Intern Med. 2004;140:945–50. - PubMed
    1. Cowie CC, Rust KF, Byrd-Holt DD, Eberhardt MS, Flegal KM, Engelgau MM, et al. Prevalence of diabetes and impaired fasting glucose in adults in the U.S. population: National Health And Nutrition Examination Survey 1999-2002. Diabetes Care. 2006;29:1263–8. - PubMed
    1. Resnick HE, Harris MI, Brock DB, Harris TB. American Diabetes Association diabetes diagnostic criteria, advancing age, and cardiovascular disease risk profiles: results from the Third National Health and Nutrition Examination Survey. Diabetes Care. 2000;23:176–80. - PubMed
    1. Conarello SL, Li Z, Ronan J, Roy RS, Zhu L, Jiang G, et al. Mice lacking dipeptidyl peptidase IV are protected against obesity and insulin resistance. Proc Natl Acad Sci U S A. 2003;100:6825–30. - PMC - PubMed

Publication types