. 2011 May 6;408(3):379-98.
doi: 10.1016/j.jmb.2011.02.047. Epub 2011 Feb 25.

Chlorite dismutases, DyPs, and EfeB: 3 microbial heme enzyme families comprise the CDE structural superfamily

Affiliations

Chlorite dismutases, DyPs, and EfeB: 3 microbial heme enzyme families comprise the CDE structural superfamily

Brandon Goblirsch et al. J Mol Biol. .

Abstract

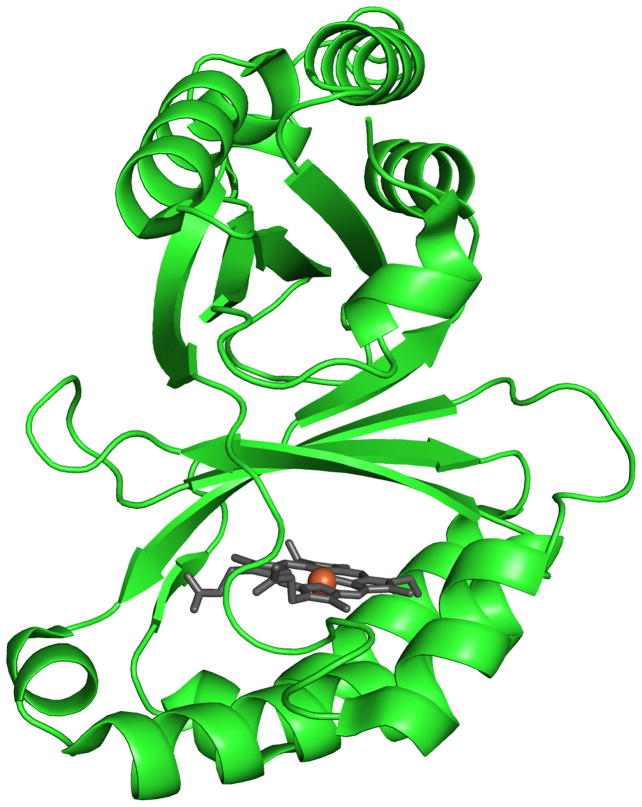
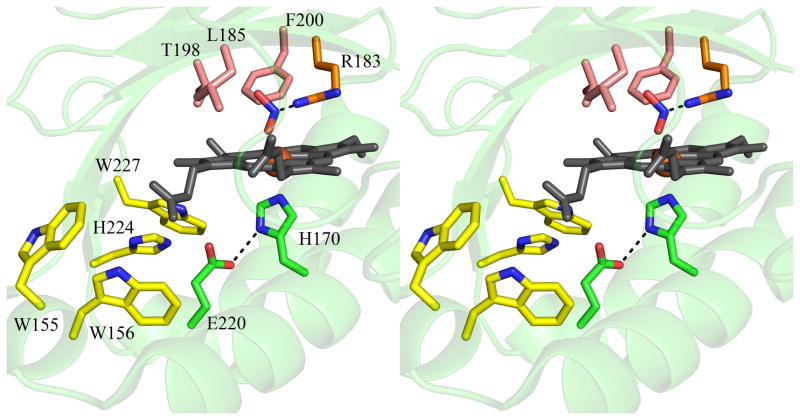
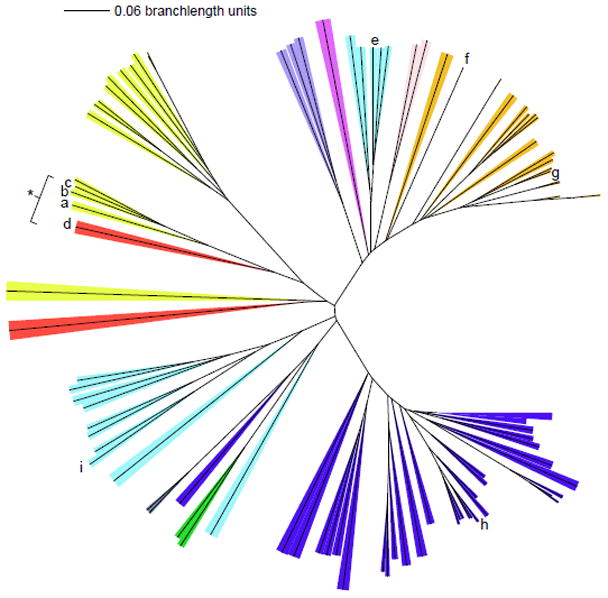
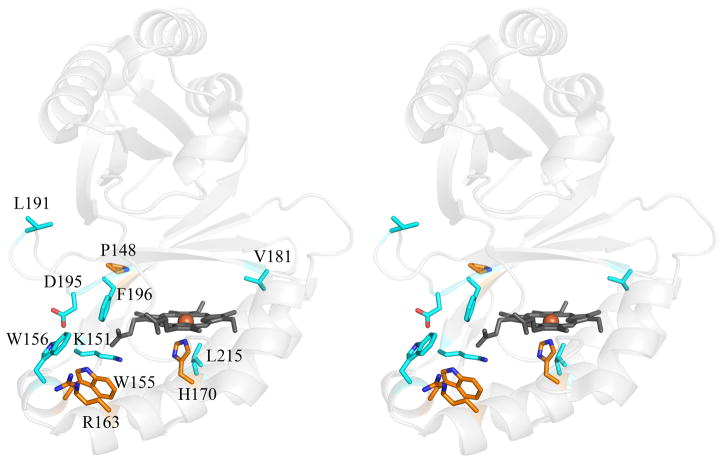
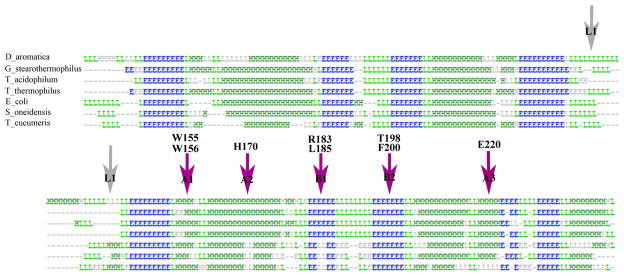
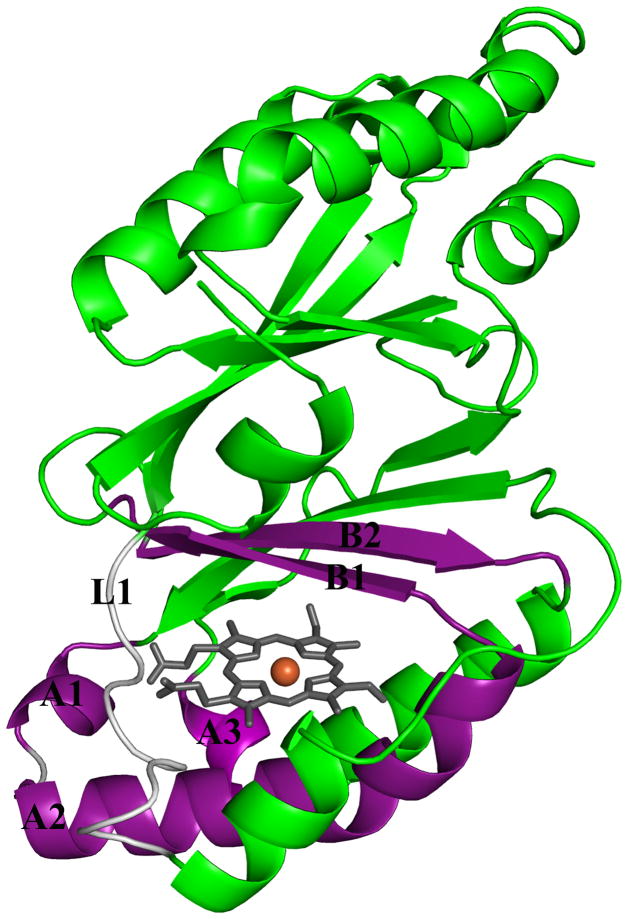
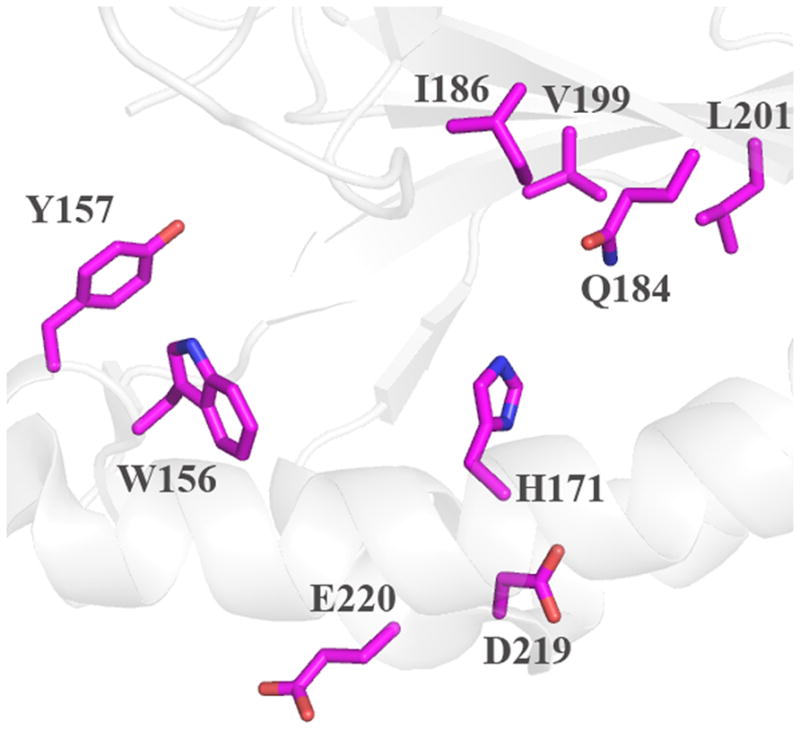
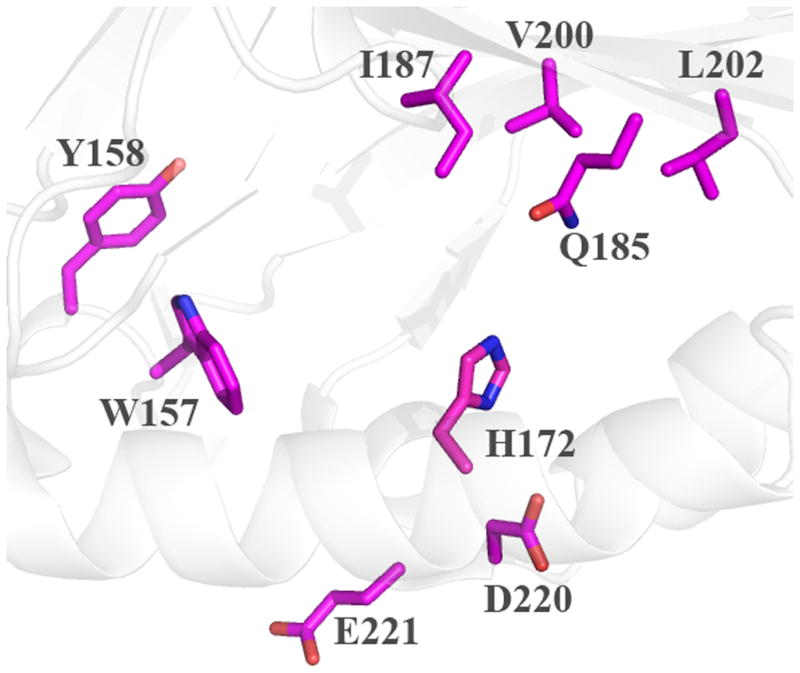
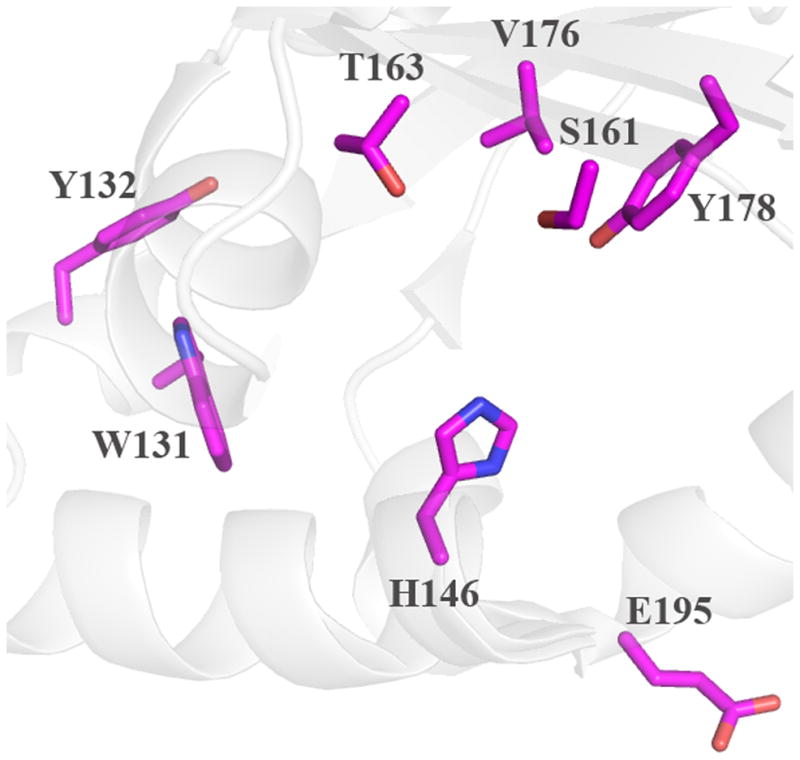
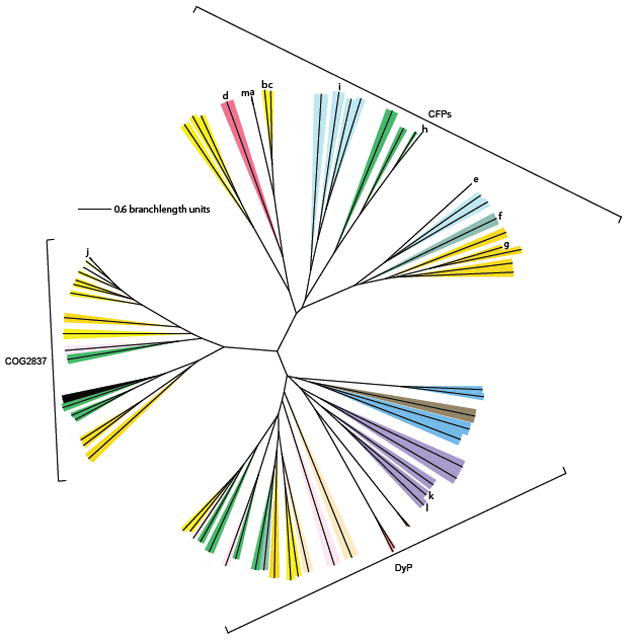
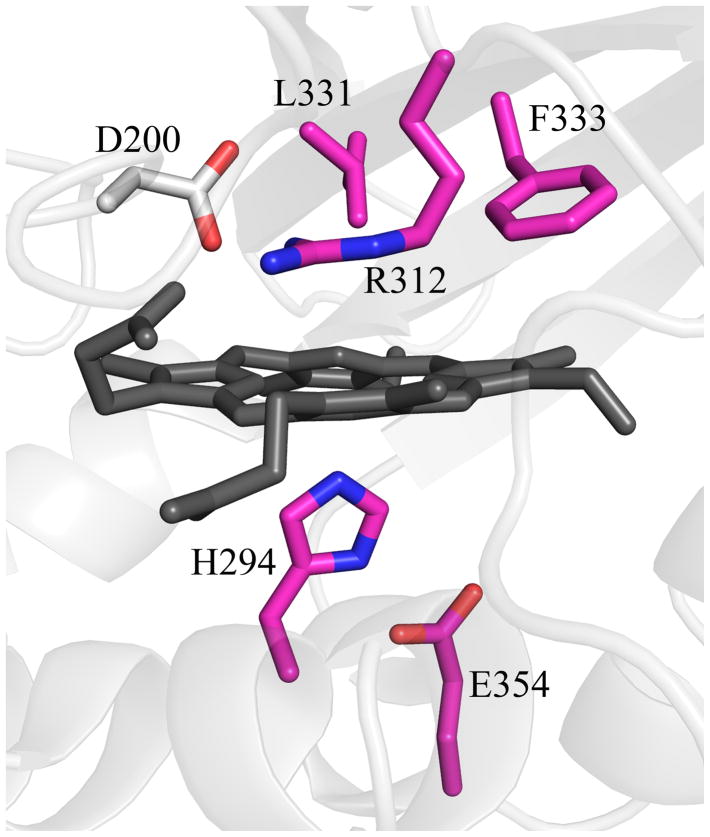
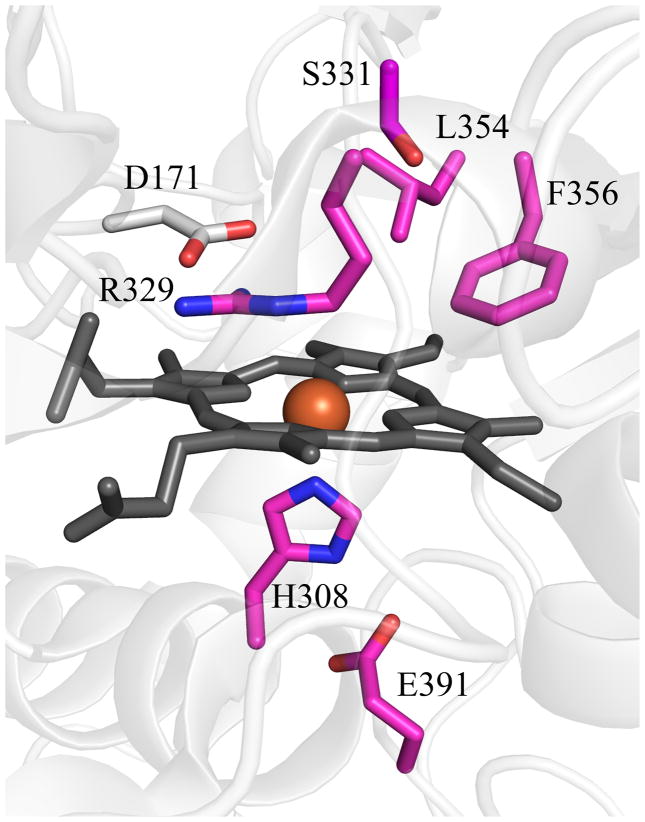
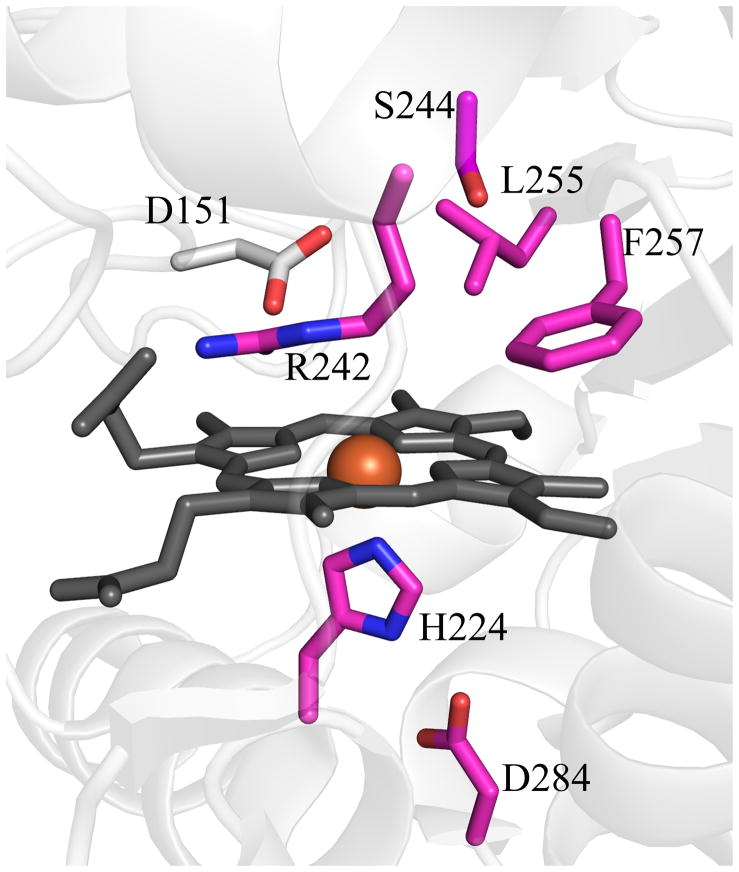
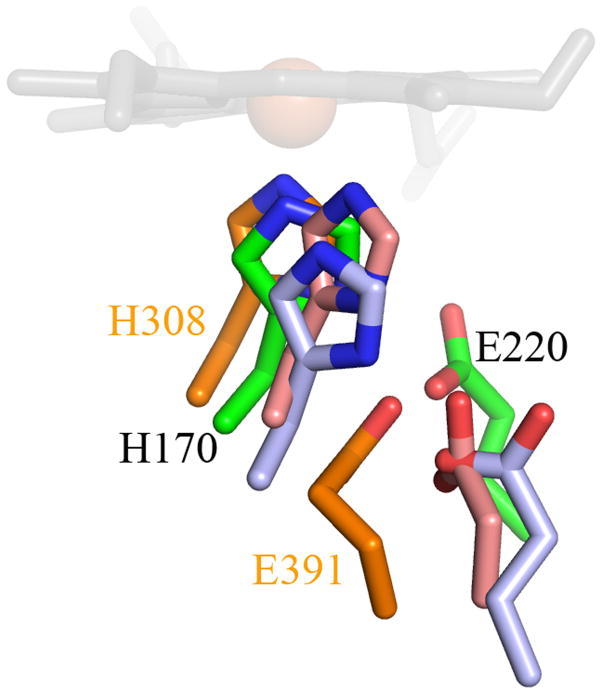
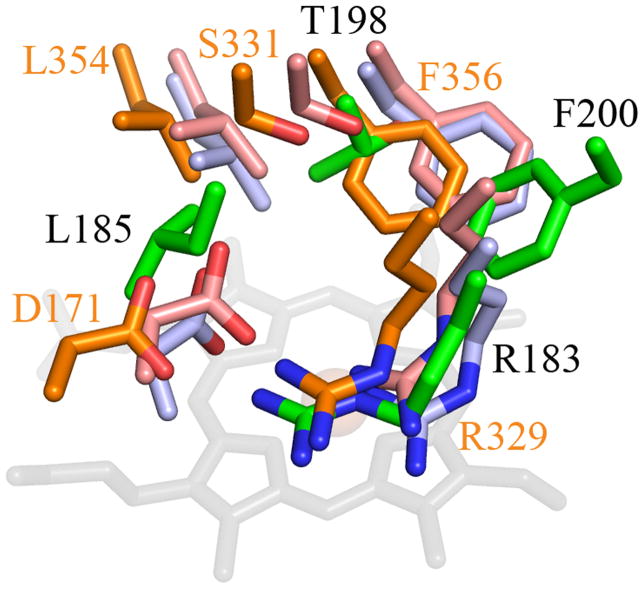
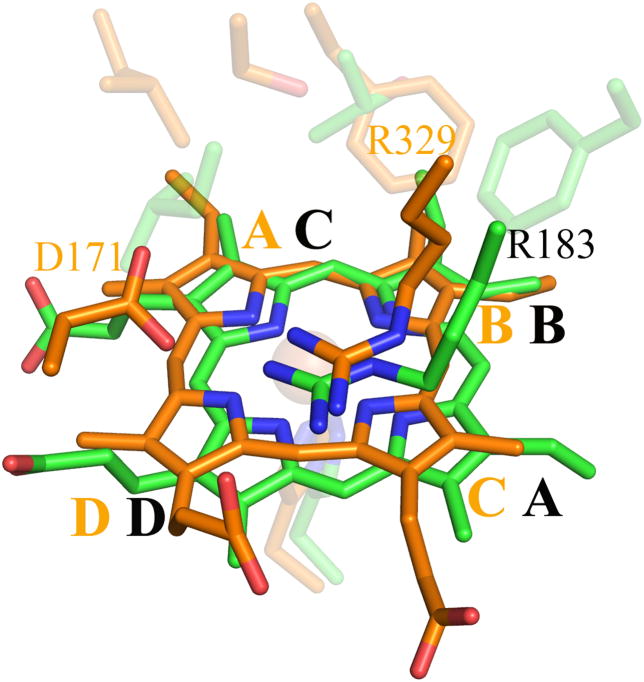
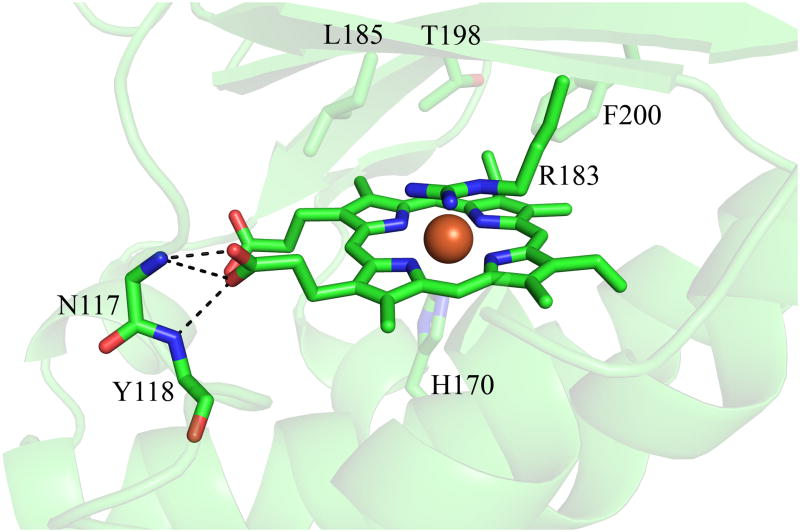
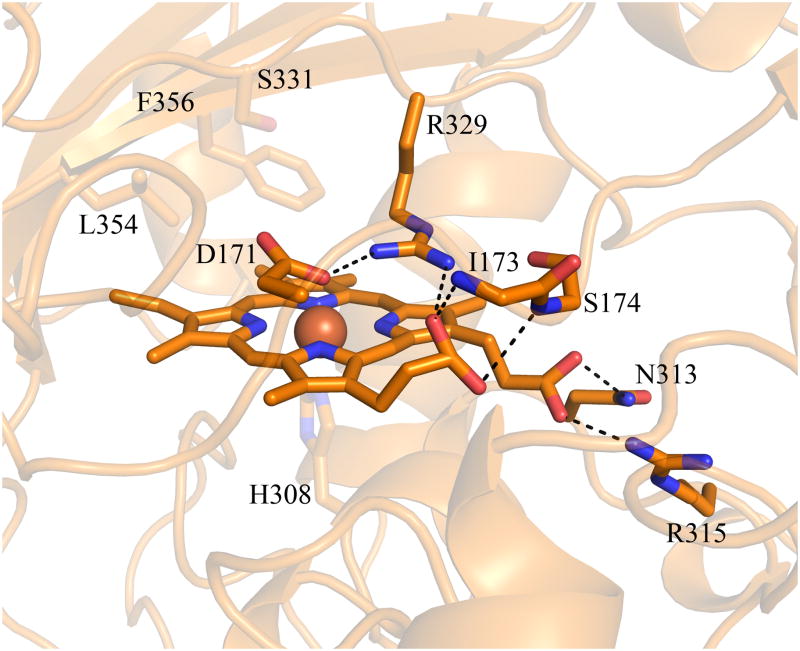
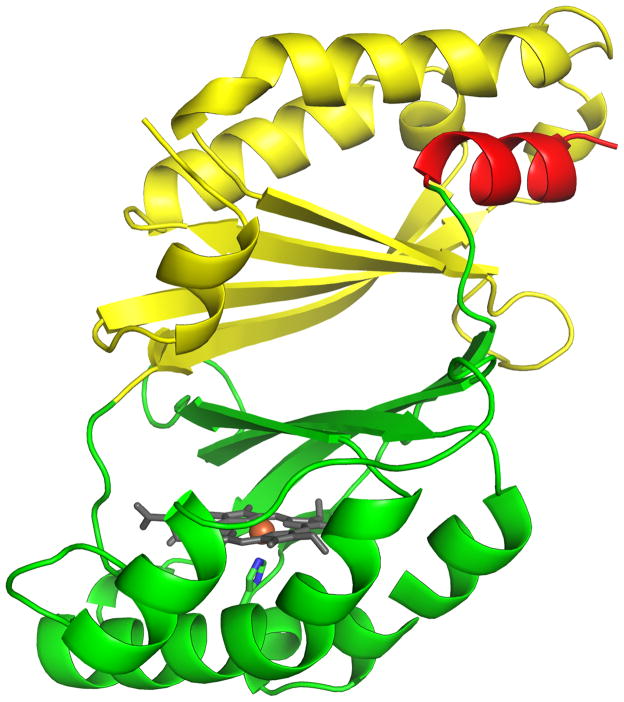
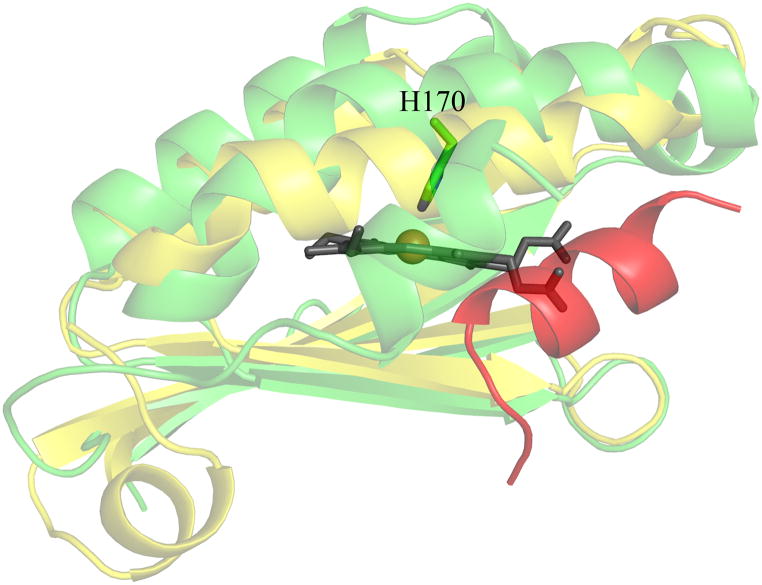
Heme proteins are extremely diverse, widespread, and versatile biocatalysts, sensors, and molecular transporters. The chlorite dismutase family of hemoproteins received its name due to the ability of the first-isolated members to detoxify anthropogenic ClO(2)(-), a function believed to have evolved only in the last few decades. Family members have since been found in 15 bacterial and archaeal genera, suggesting ancient roots. A structure- and sequence-based examination of the family is presented, in which key sequence and structural motifs are identified, and possible functions for family proteins are proposed. Newly identified structural homologies moreover demonstrate clear connections to two other large, ancient, and functionally mysterious protein families. We propose calling them collectively the CDE superfamily of heme proteins.


Figures

Figure 1
Figure 1. Overview of Dechloromonas aromatica Cld structure
(A) The monomer of DA-Cld is shown in green cartoon. (B) Stereo view of the heme-containing nitrite-bound active site with residues of possible catalytic importance highlighted. Relevant residues are represented as sticks, numbered according to the mature DA-Cld sequence and color-coded (carbons) by their proposed function in DA-Cld (See also Table 1). This figure was generated using PyMOL (http://www.pymol.org/).
Figure 2
Figure 2. Phylogenetic tree of Cld family protein sequences from diverse hosts
The phylum/kingdom affiliation of each species is indicated by color: Proteobacteria (yellow), Firmicutes (orange), Nitrospirae (red), Actinobacteria (blue), Archaea (light blue), Deinococcus-Thermus (grey), Chloroflexi (green), Planctomycetes (dark purple), Veruccomicrobia (light purple), and Acidobacteria (pink). The Halobacteriacea, pictured near the bottom of the tree, form their own group distinct from the other archea. Species known to carry out chlorite detoxification are indicated with a bracket/asterisk. CFPs originating from species mentioned in the text are as follows: (a) Dechloromonas aromatica; (b) Dechloromonas agitata; (c) Ideonella dechloratans; (d) Nitrospira defluvii; (e) Halobacterium sp. NRC-1; (f) Thermus thermophilus HB8; (g) Geobacillus stearothermophilus; (h) Mycobacterium tuberculosis; (i) Thermoplasma acidophilum. A three-iteration PSI-BLAST search was performed using DA-Cld as the bait sequence. The top 500 result sequences were aligned by ClustalX, and a phylogenetic tree was constructed. Representative sequences from each phylum were chosen for the above display. Settings used for the tree building were: random number = 111 and bootstrap maximum = 1000. The iTOL (Interactive Tree of Life) program was used for branch coloring and figure generation (http://itol.embl.de/). Bootstrap values for the major branching points and a table listing species of origin and accession numbers are included as Supplementary data.
Figure 3
Figure 3. Stereo view of DA-Cld monomer showing residues conserved among all phyla
DA-Cld monomer shown as a faded grey cartoon. Strictly and strongly conserved residues are shown as sticks and colored by atom (carbon orange and cyan respectively). Heme is drawn in grey stick, and the iron as an orange sphere. Note: all phylogenically conserved residues fall within the C-terminal domain. This figure was generated using PyMOL (http://www.pymol.org/).
Figure 4
Figure 4. Conserved regions of secondary structure from which active site residues are derived
(A) Structure alignment of CFP members with DA-Cld as identified via Dali. Aligned regions of secondary structure are labeled (H = helix; L = loop; E = β-sheet). To illustrate the conservation of core secondary structure elements, the alignment excludes insertions between aligned structures. Individual secondary structure elements that constitute the heme distal and proximal pockets are indicated by labeled arrows. Residues from DA-Cld are shown explicitly above their respective locations in discrete secondary structure elements (i.e. α-helix or β-sheet). (B) Secondary structure elements mapped onto the structure of DA-Cld. All structurally characterized enzymes within this family generate a heme-binding pocket from five separate secondary structure elements (purple). In the E.coli CFP, S. oneidensis CFP, and T. cucumeris CFP crystal structures, an aspartate residue is located in the distal pocket (PDB codes are given in Table S1). It invariably originates from a similarly positioned loop region (grey arrows). Color coding and labeling of these elements is according to (A). Images in this figure were generated using PyMOL (http://www.pymol.org/)
Figure 5
Figure 5. Active site stereo views of crystallographically characterized apo-CFPs illustrating possible heme environments
Cartoon diagram representations of protein monomers (carbon light grey) are shown, with side-chains of active site residues shown as sticks. Residues lining the expected heme pocket that fall within strictly conserved secondary structure elements are colored by atom (carbon magenta). Note that the same residues were also identified from primary sequence alignments with DA-Cld (Table 1). (A) G. stearothermophilus (Firmicutes); (B) T. thermophilus (Deinococcus-Thermus). (C) T. acidophilum (Euryarchaeota). This figure was generated using PyMOL (http://www.pymol.org/).
Figure 6
Figure 6. Phylogenetic tree illustrating relationships between CFPs, DyPs, and COG2837 proteins
Representative CFP sequences were selected from each major phylum in Figure 2 and plotted here, along with representative DyP family and COG2837 proteins. The phylum/kingdom affiliation of each species is indicated by color: Proteobacteria (yellow), Acidobacteria (light pink), Nitrospirae (dark pink), Archaea (light blue), Cyanobacteria (royal blue), Deinococcus-Thermus (teal), Firmicutes (orange), Actinobacteria (green), Ascomycota (salmon), Plantae (black), Bacteroidetes (tan), Basidiomycota (violet), and Planctomycetes (brown). Proteins originating from species mentioned in the text are as follows: a-i see legend for Figure 2; (j) Escherichia coli EfeB; (k) Thanatephorus cucumeris DyP; (l) Shewanella oneidensis TyrA. The following was performed using bait sequences EfeB from E. coli and DyP from T. cucumeris: a three-iteration PSI-BLAST search yielded top 500 result sequences which were aligned by ClustalX. For this tree, EfeB homologs with a PSI-BLAST E-value above 3×10−68 and DyP sequences with a PSI-BLAST E-value above 2×10⁻²² were eliminated, leaving approximately 250 sequences from each family, a subset of which are shown on the tree. Bootstrap values for the major branching points and a table listing species of origin and accession numbers are included as Supplementary data.
Figure 7
Figure 7. Top structural homologs to DA-Cld outside the CFPs as identified by Dali
(A) EfeB from Escherichia coli; (B) DyP from Thanatephorus cucumeris; (C) TyrA from Shewanella oneidensis. PDB codes are given in Table S1. Cartoon diagram representations of protein monomers (carbon grey) are shown, with side-chains of proposed key active site residues shown as sticks. On the monomers, residues that form the enzyme active site and originate from conserved secondary structure elements as seen in Figure 4 are colored by atom (carbon magenta). An Asp residue that is strictly conserved in EfeB and DyP family proteins is absent in CFPs (carbon grey). This figure was generated using PyMOL (http://www.pymol.org/).
Figure 8
Figure 8. Stereo view overlay of Cld and EfeB/DyP family heme environments
(A) Key proximal pocket residues. (B) Distal residues. Drawn as stick colored by atom. Carbon coloring DA-Cld, green; EfeB, light blue; DyP, orange; TyrA, pink. Residues in DA-Cld are labeled in black, while those of DyP are labeled in orange. DyP and TyrA distal pockets also contain an additional residue with no correlate in the other structures (S331 and S244 respectively). The heme of DA-Cld is drawn in grey sticks and the Fe center represented as an orange sphere. This figure was generated using PyMOL (http://www.pymol.org/).
Figure 9
Figure 9. Hemes of DA-Cld and DyP
(A) Stereo view comparing heme orientation in DA-Cld and DyP. (B) Interactions of the propionates of DA-Cld. (C) Interactions of the propionates of DyP. Active site residues and hemes are shown as sticks and colored by atom with DA-Cld (carbon green) and DyP (carbon orange). Regions associated with DyP are labeled in orange font. Pyrrole rings of the heme b cofactor are labeled and shown in bolded font. The hemes in DA-Cld and Dyp are related by a 180° flip along an axis through pyrrole positions D and B. This figure was generated using PyMOL (http://www.pymol.org/).
Figure 10
Figure 10. Structural homology between the domains of the structural superfamily
(A) Cartoon of the DA-Cld monomer with the N-terminal domain colored in yellow, and the C-terminal heme-binding domain colored in green. The C-terminal helix is colored in red. Heme is drawn explicitly in stick colored by atom, and iron is drawn as an orange sphere. (B) N-terminal and C-terminal domains overlaid. The alignments is done with the program SUPERPOSE (30). Colors as in panel A. This figure was generated using PyMOL (http://www.pymol.org/).
Scheme 1
Scheme 1
Proposed mechanisms for chlorite decomposition and O2 evolution catalyzed by DA-Cld. A Cld-chlorite Michaelis complex forms. (Top) Heterolytic bond cleavage yields the ferryl-porphyrin cation radical intermediate (Compound I) and hypochlorite as the leaving group. The oxygen atom of hypochlorite acts as a nucleophile toward the electron-deficient Compound I, forming a peroxychlorite anion that rapidly breaks down into products. (Bottom) The same Michaelis complex reacts via homolytic cleavage of the (O)Cl-O bond, yielding the ferryl-porphyrin complex (Compound II) and the hypochloryl radical. Recombination of the radicals yields the peroxychlorite anion and then the reaction products.

References

    1. Clark JJ. Toxicology of perchlorate. In: Urbansky ET, editor. Perchlorate in the Environment. Kluwer Academic/Plenum; New York: 2000.
    1. Hauntman DP, et al. Determination of perchlorate in drinking water using ion chromotography, revision 1 Method 314, Doc No EPA/815/B-99/003. US Environmental Protection Agency; 1999.
    1. Urbansky ET. Perchlorate as an environmental contaminant. Environ Sci Pollut Res Int. 2002;9:187–192. - PubMed
    1. Christen K. EPA perchlorate decision takes many by surprise. Environ Sci Technol. 2003;37:347A–348A. - PubMed
    1. Xu JL, Song YU, Min BK, Steinberg L, Logan BE. Microbial degradation of perchlorate: Principles and applications. Environ Eng Sci. 2003;20:405–422.

Publication types

MeSH terms

LinkOut - more resources