. 2011 Mar;134(Pt 3):769-82.
doi: 10.1093/brain/awr005.

Dissociations between behavioural and functional magnetic resonance imaging-based evaluations of cognitive function after brain injury

Affiliations

Dissociations between behavioural and functional magnetic resonance imaging-based evaluations of cognitive function after brain injury

Jonathan C Bardin et al. Brain. 2011 Mar.

Abstract

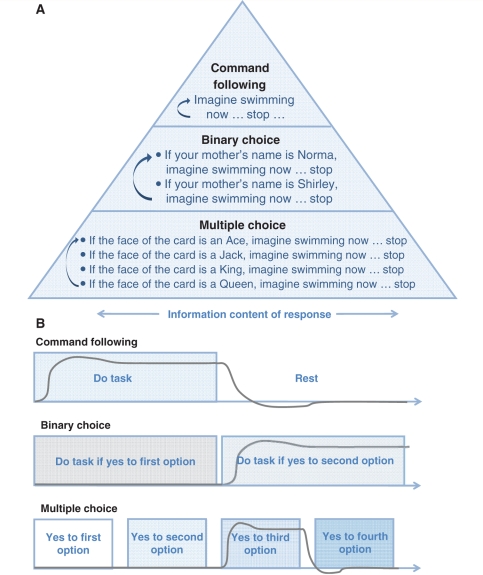
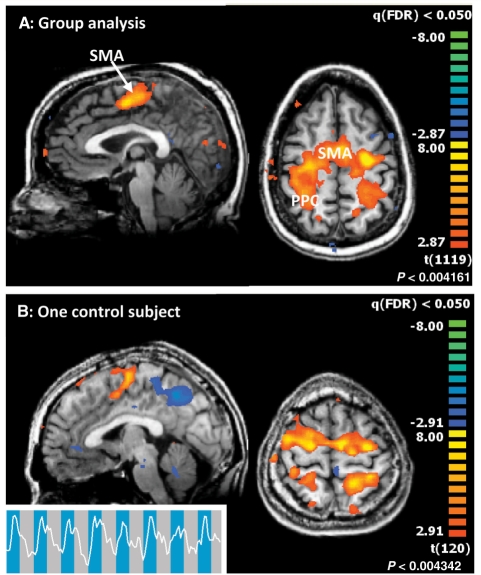
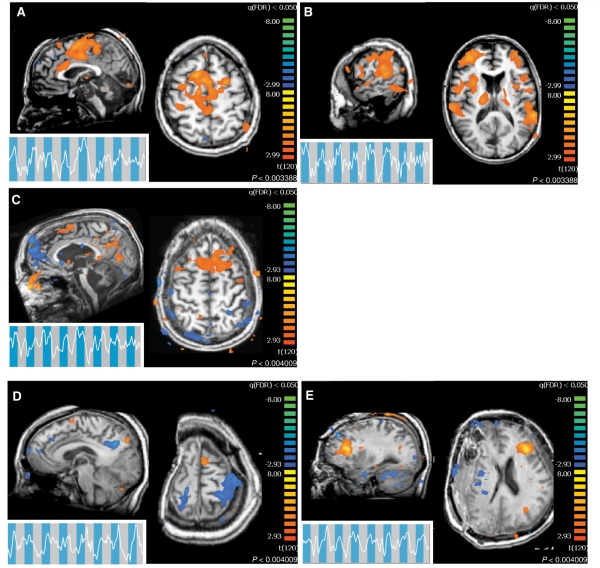
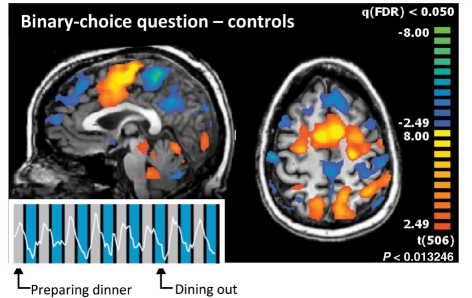
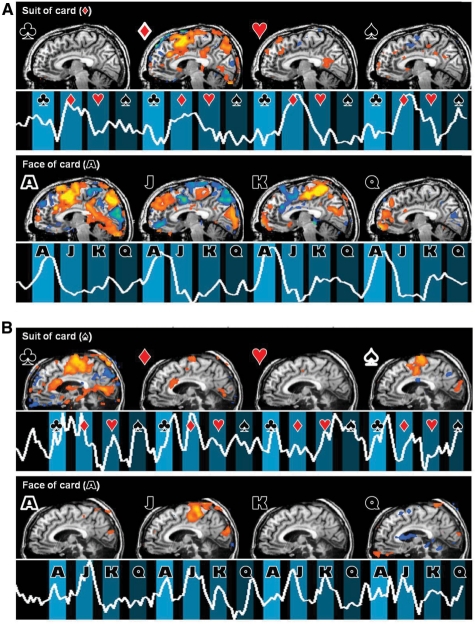
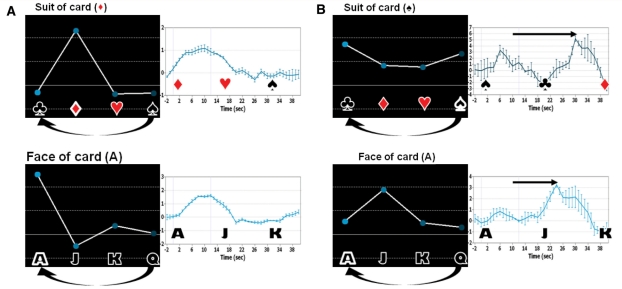
Functional neuroimaging methods hold promise for the identification of cognitive function and communication capacity in some severely brain-injured patients who may not retain sufficient motor function to demonstrate their abilities. We studied seven severely brain-injured patients and a control group of 14 subjects using a novel hierarchical functional magnetic resonance imaging assessment utilizing mental imagery responses. Whereas the control group showed consistent and accurate (for communication) blood-oxygen-level-dependent responses without exception, the brain-injured subjects showed a wide variation in the correlation of blood-oxygen-level-dependent responses and overt behavioural responses. Specifically, the brain-injured subjects dissociated bedside and functional magnetic resonance imaging-based command following and communication capabilities. These observations reveal significant challenges in developing validated functional magnetic resonance imaging-based methods for clinical use and raise interesting questions about underlying brain function assayed using these methods in brain-injured subjects.


Figures

Figure 1
Figure 1
Paradigm. (A) Different levels of functional MRI to evaluate different levels of awareness. (B) Our timing paradigm is based on the time of response for one established brain area, as obtained for example from the command-following step. A schematic response time course of the blood-oxygen-level-dependent signal is shown in grey for a response to the second alternative in the binary answer and the third alternative in the multiple choice answer.
Figure 2
Figure 2
Command-following task. (A) Group analysis of the command-following task in normal subjects. The nine subjects imagined themselves swimming. Areas of activation are predominantly in the supplementary motor area, partially extending laterally into the premotor areas, and parts of the posterior parietal cortex. (x = −2 mm, z = 48 mm in Talairach space). (B) Bottom panel: Single subject result for command-following (swimming, Subject 5). All individual control subject results for ‘swimming’ imagery are shown in Supplementary Fig. 1. (x = −2 mm, z = 60 mm in Talairach space.).
Figure 3
Figure 3
Clinical subject command-following task. Command-following task results for the subjects with brain injury who demonstrated a statistically significant response. Time series are local spatial averages around the maximum activation in the supplementary motor area and are overlaid onto the task blocks: blue, sports imagery; grey, rest. In all activation maps, P < 0.05 false discovery rate. For all subjects, the task was the auditory presentation of ‘imagine yourself swimming’ (Fig. 1). All coordinates are given in Talairach space. (A) Subject 1 command-following response, midline slice (x = −2 mm, z = 52 mm). (B) Subject 1 command-following response, lateral slice (x = −58 mm, z = 14 mm). (C) Subject 2 command-following response (x = −4 mm, z = 58 mm). (D) Subject 3, visit 1, command-following response (x = −1 mm, z = 65 mm). (E) Subject 3, visit 2, command-following response (x = −30 mm, z = 21 mm).
Figure 4
Figure 4
Binary choice communication task. The six subjects each imagined their favourite sports activity to answer one of the two questions ‘do you prefer to prepare dinner yourself’ or ‘do you prefer eating out’ with ‘yes’. Shown here is the average activation map for the four subjects who preferred to prepare dinner themselves and a representative time course of one of these subjects (Subject 10), overlaid onto blue colour for ‘dining out’ and grey colour for ‘preparing dinner’. Individual control subject results are shown in Supplementary Fig. 2. (P < 0.05 false discovery rate, fixed-effects analysis. The time series is a local spatial average around the maximum activation in the supplementary motor area. x = −2 mm, z = 48 mm in Talairach space).
Figure 5
Figure 5
Multiple choice communication task. (A) Multiple-choice communication task results from one normal subject who picked the Ace of Diamonds card. The subject (Subject 13) responded with rock climbing imagery. The time course represents the blood-oxygen-level-dependent signal in the supplementary motor area cluster (suit) and the posterior parietal cortex (face), each in the region with the strongest blood-oxygen-level-dependent response. The symbols next to the brain indicate the used contrast for generating the SPM [club, diamond, heart, spade (suit) and ace, jack, king, queen (face)]. Individual control subject results are shown in Supplementary Fig. 2. (B) Same for Clinical Subject 1. The card picked for the clinical subject is ace of spades, and the patient was instructed to respond with swimming imagery. (In all activation maps, Z = −6, P < 0.05 false discovery rate. Time series are local spatial averages around the maximum activation in the supplementary motor area x = −6 mm in Talairach space).
Figure 6
Figure 6
Interpretation of Clinical Subject 1 data as delayed response. Relative magnitudes of the fit coefficients of the general linear model, in dependence of stimuli, for one normal subject (A) and Clinical Subject 1 (B) left panels of each column, and corresponding trial-averaged haemodynamic response curves for an area of strong activation, right panels. Since the stimuli are applied cyclically (four times), club follows spade and ace follows queen. Both the face and suit causing maximal activations in the patient’s time series (i.e. jack, club) immediately follow the correct suit and face options (ace, spade). The trial averages in the right panels start at the time when the correct suit or face of the selected card is played out. The subject with brain injury shows a peak response ∼14–20 s delayed relative to the peak latency of ∼10 s seen in both time series obtained from the normal subject. These time intervals are indicated by arrows. For the suit time series, a weak initial response at ∼6 s is seen in the brain injured subject’s response, which also showed significant activations for both the club and ace.

References

    1. Bardin JC, Fins JJ, Hersh J, Heier LA, Schiff ND, Voss HU. Multiple choice fMRI in severely brain injured patients. Neuroscience. 2009 -S-1557-SfN.
    1. Benjamini Y, Hochberg Y. Controlling the false discovery rate––a practical and powerful approach to multiple testing. J R Stat Soc Series B Stat Methodol. 1995;57:289–300.
    1. Boly M, Coleman MR, Davis MH, Hampshire A, Bor D, Moonen G, et al. When thoughts become action: an fMRI paradigm to study volitional brain activity in non-communicative brain injured patients. Neuroimage. 2007;36:979–92. - PubMed
    1. Boly M, Faymonville ME, Peigneux P, Lambermont B, Damas P, Del Fiore G, et al. Auditory processing in severely brain injured patients - differences between the minimally conscious state and the persistent vegetative state. Arch Neurol. 2004;61:233–8. - PubMed
    1. Carrai R, Grippo A, Fossi S, Campolo MC, Lanzo G, Pinto F, et al. Transient post-traumatic locked-in syndrome: A case report and a literature review. Clin Neurophysiol. 2009;39:95–100. - PubMed

Publication types