

Exploring the spatial distribution of light interception and photosynthesis of canopies by means of a functional-structural plant model
- PMID: 21355008
- PMCID: PMC3077986
- DOI: 10.1093/aob/mcr006
Exploring the spatial distribution of light interception and photosynthesis of canopies by means of a functional-structural plant model
Abstract
Background and aims: At present most process-based models and the majority of three-dimensional models include simplifications of plant architecture that can compromise the accuracy of light interception simulations and, accordingly, canopy photosynthesis. The aim of this paper is to analyse canopy heterogeneity of an explicitly described tomato canopy in relation to temporal dynamics of horizontal and vertical light distribution and photosynthesis under direct- and diffuse-light conditions.
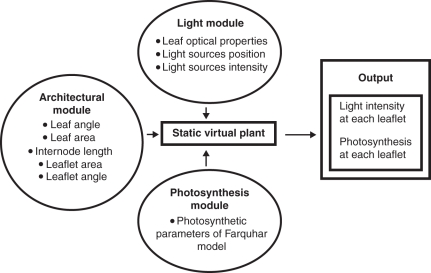
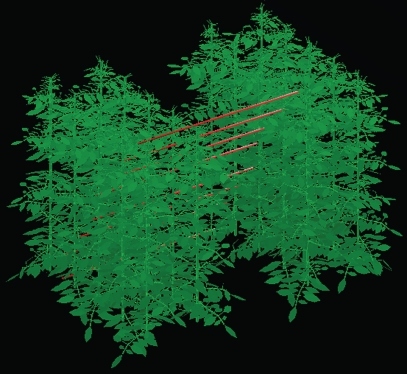
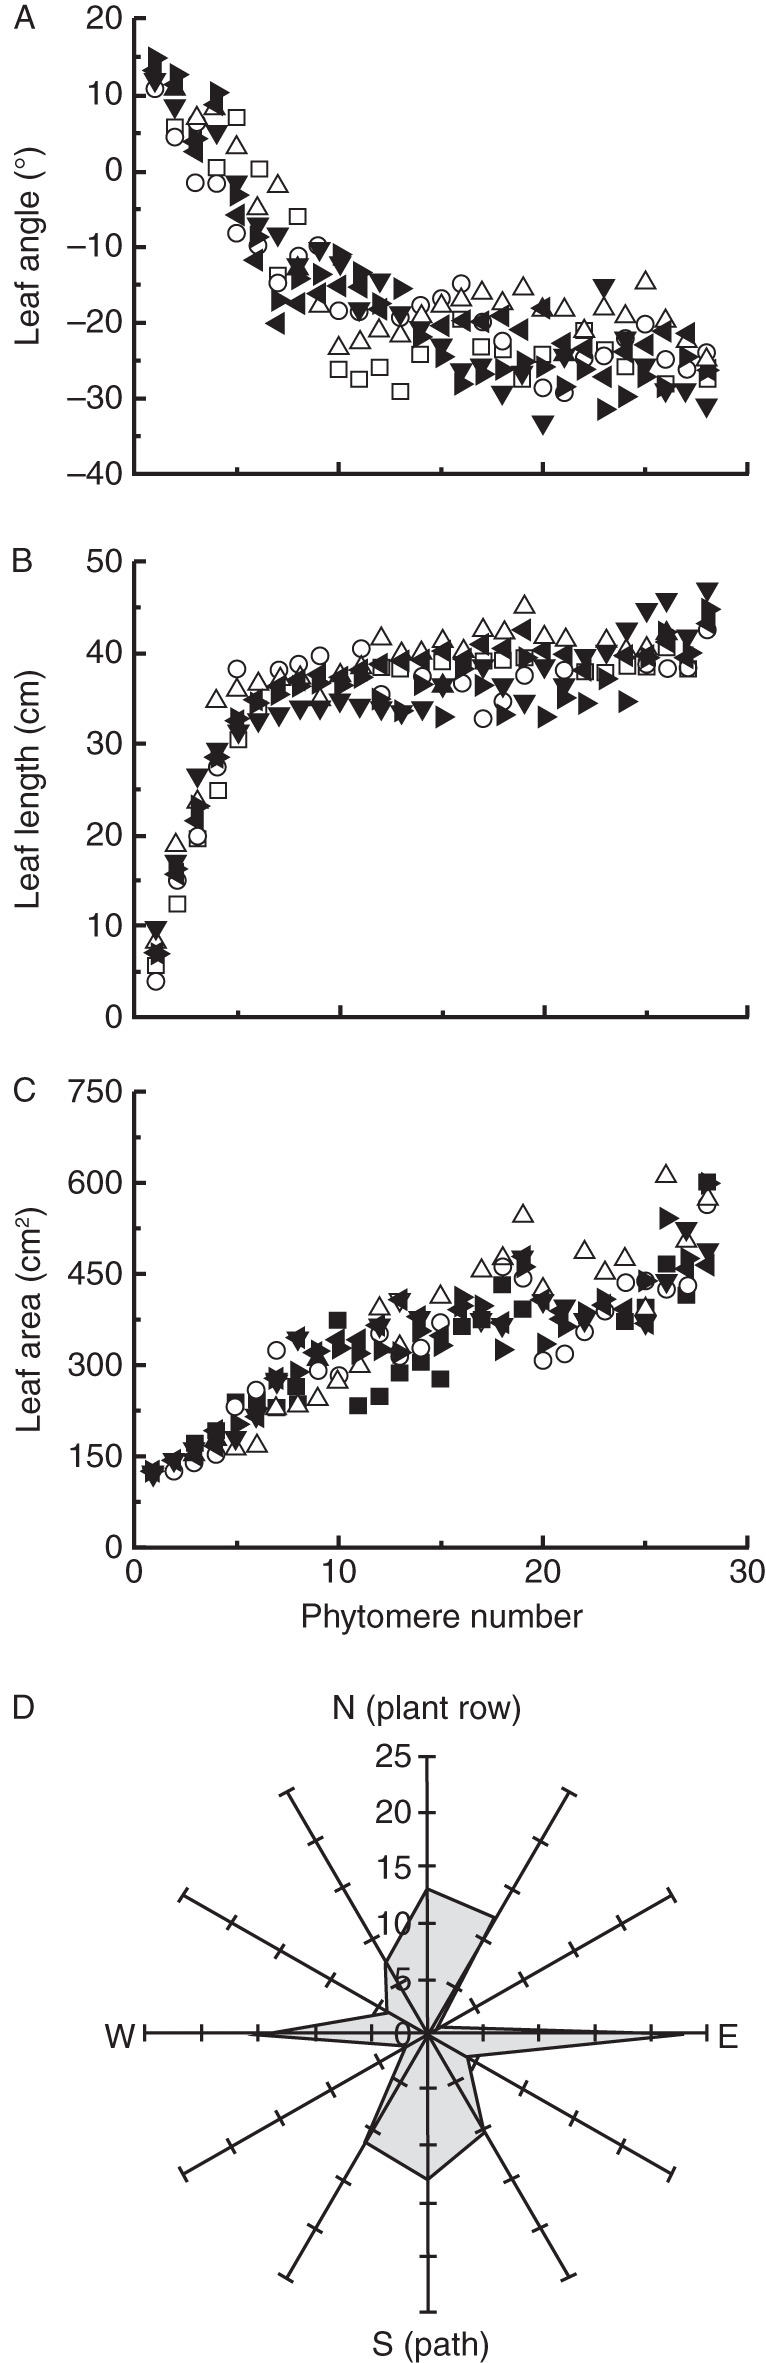
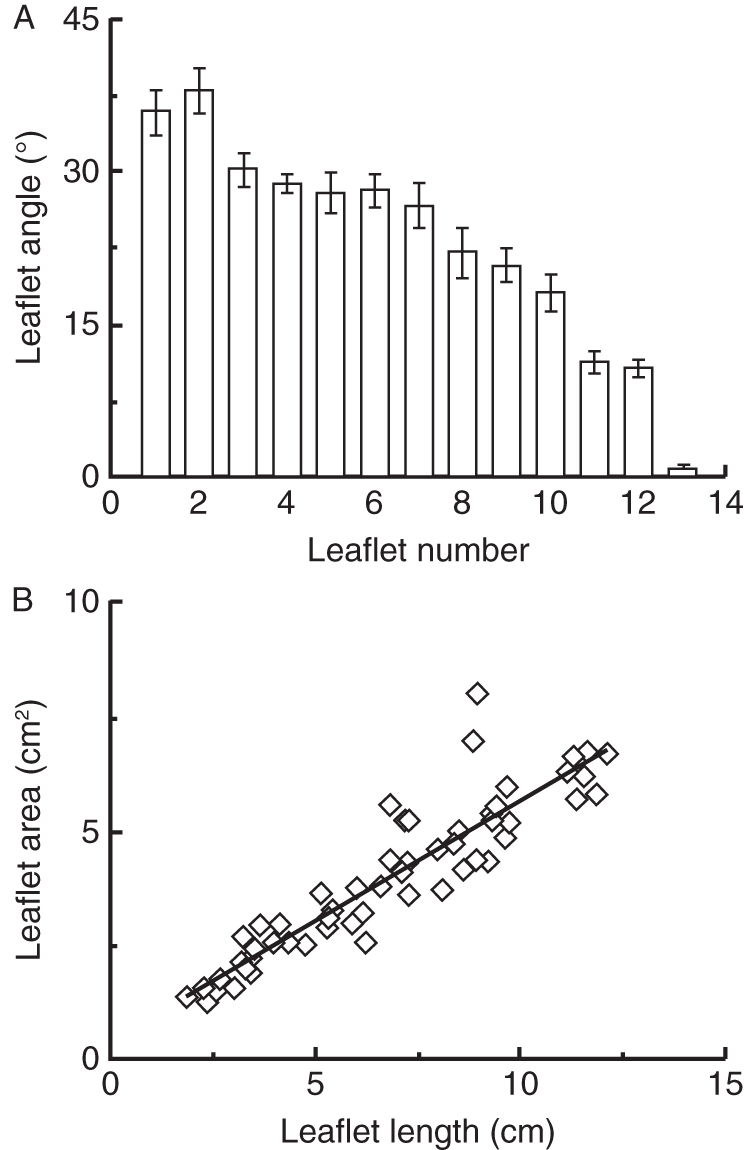
Methods: Detailed measurements of canopy architecture, light interception and leaf photosynthesis were carried out on a tomato crop. These data were used for the development and calibration of a functional-structural tomato model. The model consisted of an architectural static virtual plant coupled with a nested radiosity model for light calculations and a leaf photosynthesis module. Different scenarios of horizontal and vertical distribution of light interception, incident light and photosynthesis were investigated under diffuse and direct light conditions.
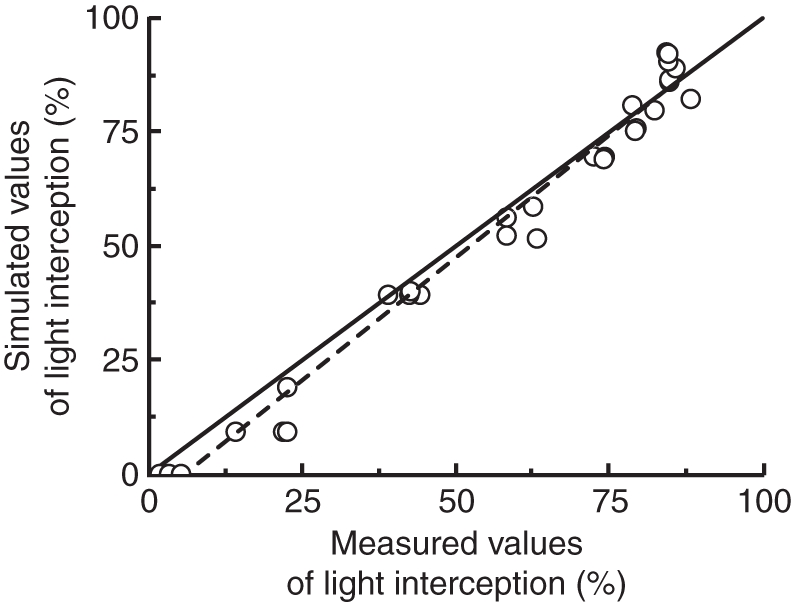
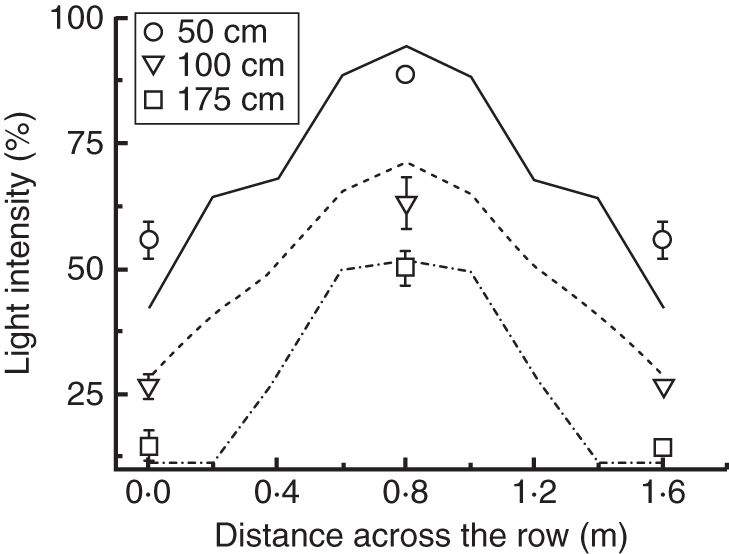
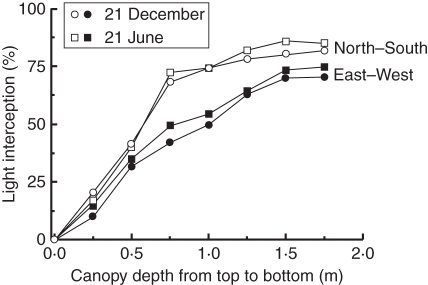
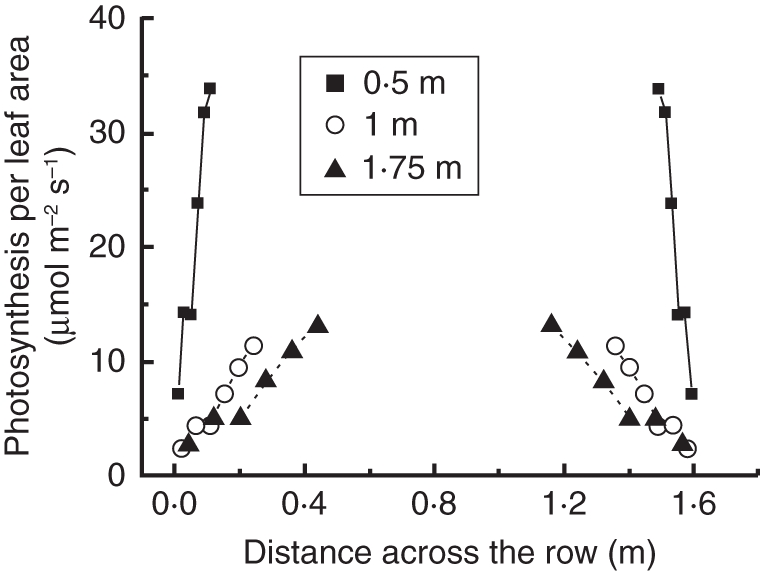
Key results: Simulated light interception showed a good correspondence to the measured values. Explicitly described leaf angles resulted in higher light interception in the middle of the plant canopy compared with fixed and ellipsoidal leaf-angle distribution models, although the total light interception remained the same. The fraction of light intercepted at a north-south orientation of rows differed from east-west orientation by 10 % on winter and 23 % on summer days. The horizontal distribution of photosynthesis differed significantly between the top, middle and lower canopy layer. Taking into account the vertical variation of leaf photosynthetic parameters in the canopy, led to approx. 8 % increase on simulated canopy photosynthesis.
Conclusions: Leaf angles of heterogeneous canopies should be explicitly described as they have a big impact both on light distribution and photosynthesis. Especially, the vertical variation of photosynthesis in canopy is such that the experimental approach of photosynthesis measurements for model parameterization should be revised.
Figures
References
-
- Atherton JG, Rudich J. The tomato crop: a scientific basis for improvement. London: Chapman and Hall; 1986.
-
- Baldocchi DD, Finnigan JJ, Wilson KW, Paw KT, Falge E. On measuring net ecosystem carbon exchange in complex terrain over tall vegetation. Boundary Layer Meteorology. 2000;96:257–291.
-
- Björkman O, Powles B. Inhibition of photosynthetic reactions under water stress: interaction with light level. Planta. 1984;161:490–504. - PubMed
-
- Borger CPD, Hashem A, Pathan S. Manipulating crop row orientation to suppress weeds and increase crop yield. Weed Science. 2010;58:174–178.
Publication types
MeSH terms
LinkOut - more resources
Full Text Sources
Other Literature Sources
