. 2011 May 5;117(18):4953-63.
doi: 10.1182/blood-2010-11-316885. Epub 2011 Feb 25.

Causal relationship between hyperfibrinogenemia, thrombosis, and resistance to thrombolysis in mice

Affiliations

Causal relationship between hyperfibrinogenemia, thrombosis, and resistance to thrombolysis in mice

Kellie R Machlus et al. Blood. .

Abstract

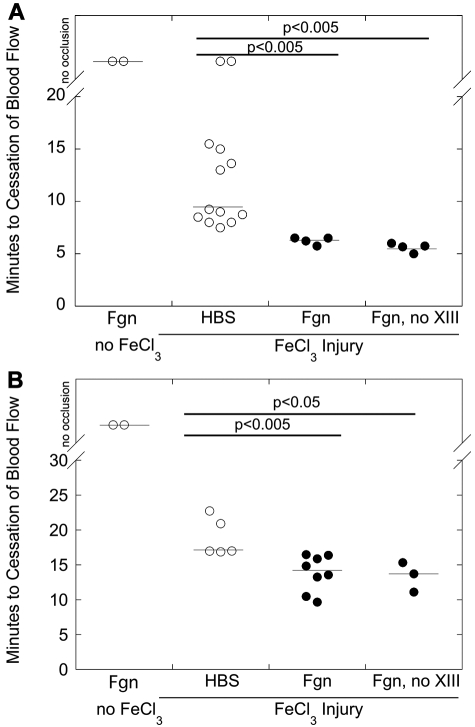
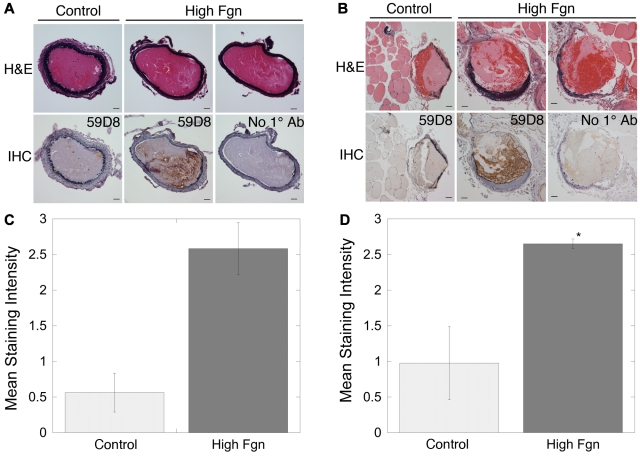
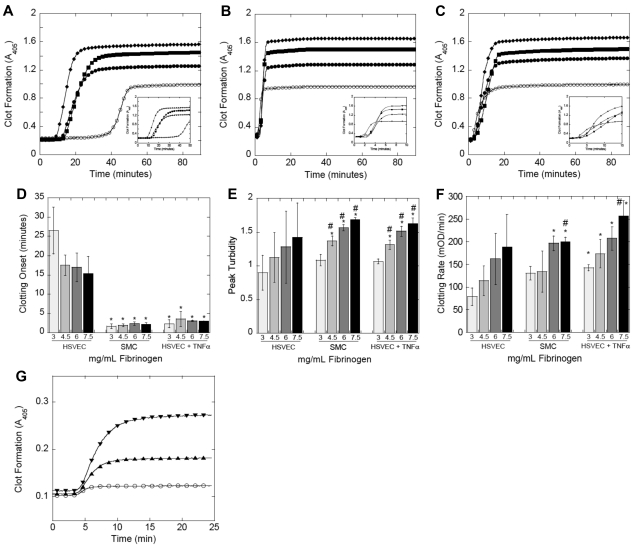
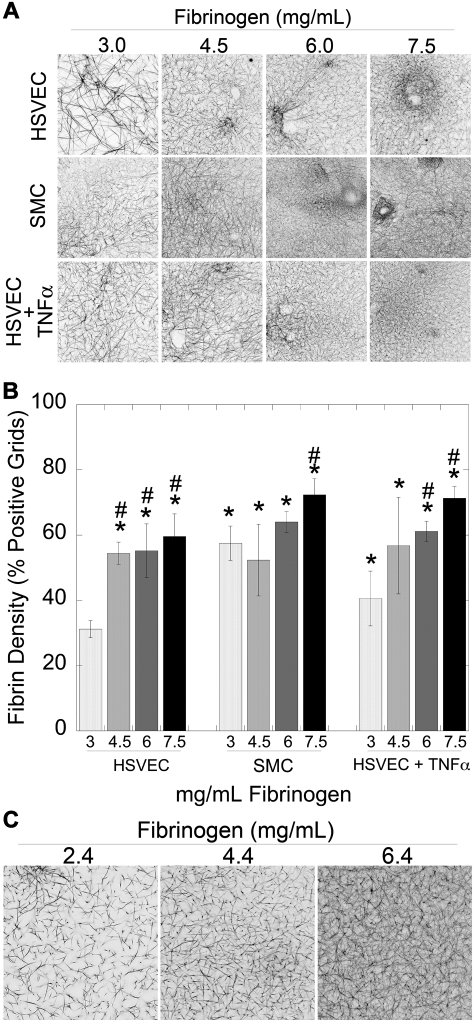
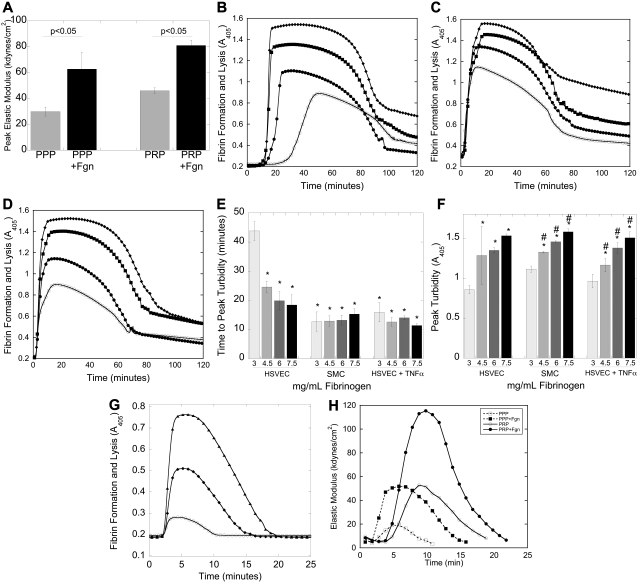
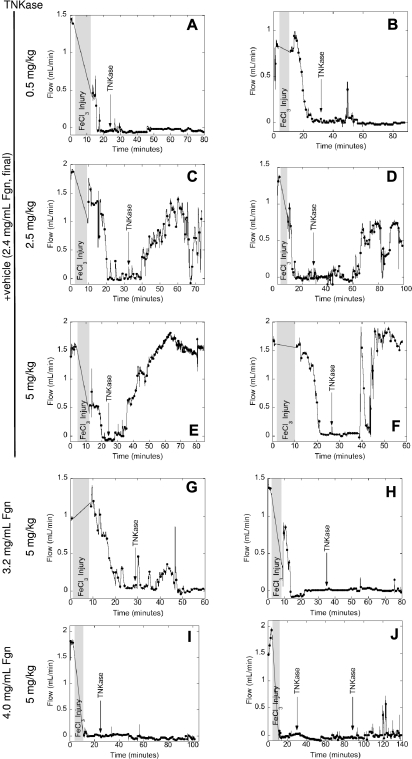
Epidemiologic studies have correlated elevated plasma fibrinogen (hyperfibrinogenemia) with risk of cardiovascular disease and arterial and venous thrombosis. However, it is unknown whether hyperfibrinogenemia is merely a biomarker of the proinflammatory disease state or is a causative mechanism in the etiology. We raised plasma fibrinogen levels in mice via intravenous infusion and induced thrombosis by ferric chloride application to the carotid artery (high shear) or saphenous vein (lower shear); hyperfibrinogenemia significantly shortened the time to occlusion in both models. Using immunohistochemistry, turbidity, confocal microscopy, and elastometry of clots produced in cell and tissue factor-initiated models of thrombosis, we show that hyperfibrinogenemia increased thrombus fibrin content, promoted faster fibrin formation, and increased fibrin network density, strength, and stability. Hyperfibrinogenemia also increased thrombus resistance to tenecteplase-induced thrombolysis in vivo. These data indicate that hyperfibrinogenemia directly promotes thrombosis and thrombolysis resistance and does so via enhanced fibrin formation and stability. These findings strongly suggest a causative role for hyperfibrinogenemia in acute thrombosis and have significant implications for thrombolytic therapy. Plasma fibrinogen levels may be used to identify patients at risk for thrombosis and inform thrombolytic administration for treating acute thrombosis/thromboembolism.


Figures

Figure 1
Figure 1
Elevated fibrinogen shortens the time to vessel occlusion after FeCl3 injury. Wild-type C57Bl/6 mice were infused with HBS or fibrinogen (plasminogen-, fibronectin-, and VWF-depleted or plasminogen-, fibronectin-, VWF-, and factor XIII-depleted) to 170% of normal. Thrombosis was induced by FeCl3 application to the carotid artery (A) or saphenous vein (B), and the TTO was determined by flow probe or Doppler, respectively. In vessels that did not occlude, the TTO was recorded as 45 minutes. Each point represents a separate mouse. Lines indicate median values.
Figure 2
Figure 2
Elevated fibrinogen increases fibrin(ogen) incorporation into thrombi after FeCl3 injury. Representative sections through thrombi after FeCl3 injury to the carotid artery (A) or saphenous vein (B). Hematoxylin and eosin staining shows regions of protein and packed erythrocytes. Immunohistochemistry (IHC) for fibrin (59D8) on corresponding sections shows darker staining for fibrin(ogen) at the thrombi margins and in thrombi from hyperfibrinogenemic (170% fibrinogen) mice. “No 1° Ab” indicates antibody 59D8 was omitted from IHC as a negative control. Staining intensity (on a scale of 0-3) was normalized to assign the value of 3 to the most intensely stained section in each vessel separately. Mean staining intensity from immunohistochemistry images from 3 separate carotid arteries (C) or 4 separate saphenous veins (D) for each condition was determined as described in “Hematoxylin and eosin staining and immunohistochemistry” and compared with control (wild-type) carotid artery (P = .1) and saphenous vein, respectively. *P < .05.
Figure 3
Figure 3
Both cellular PCA and elevated fibrinogen promote fibrin formation. (A-F) Recalcified (16mM, final) human NPP spiked with fibrinogen or HBS was added to confluent cell monolayers. Fibrin polymerization was measured by turbidity at 405 nm. (A-C) Polymerization curves representative of 4 independent experiments with human NPP and unstimulated HSVECs (A), SMCs (B), and TNF-α-HSVECs (C). Insets expand the x-axis (time) for each panel. Symbols are as follows: 3 mg/mL (○), 4.5 mg/mL (●), 6 mg/mL (■), and 7.5 mg/mL (♦) fibrinogen, final. (D-F) The onset, final turbidity, and fibrin formation rate (mean ± SD) of all 4 experiments with human NPP, respectively. *P < .05 vs 3 mg/mL fibrinogen on HSVECs. #P < .05 vs 3 mg/mL within each cell type. (G) Recalcified murine PPP was spiked with human fibrinogen or HBS, diluted 1:3 in HBS, and clotting was initiated with TF addition (Innovin 1:30 000 final) and monitored by turbidity at 405 nm. Symbols are as follows: 2.4 mg/mL (○), 4.4 mg/mL (▴), or 6.4 mg/mL (▾) fibrinogen, final. Polymerization curves are from a single experiment representative of 4 independent experiments.
Figure 4
Figure 4
Both cellular PCA and the fibrinogen level modulate fibrin network density. (A-B) Clots were formed by incubating unstimulated HSVECs, SMCs, and TNF-α–stimulated HSVEC monolayers with recalcified human NPP spiked with human fibrinogen or BSA, as indicated, and imaged by laser scanning confocal microscopy as described., (A) Representative micrographs (146 × 146 μm, xy) show 3-dimensional projections from 10-μm stacks at the cell surface (n ≥ 3). Darker areas represent increased fibrin density. (B) Fibrin network density (mean ± SD) of clots was determined as described in “Laser scanning confocal microscopy.” *P < .05 versus 3 mg/mL fibrinogen on HSVECs. #P < .05 versus 3 mg/mL within each cell type. (C) Clots were formed by addition of TF (1:30 000 Innovin) to recalcified murine PPP spiked with human fibrinogen or HBS.
Figure 5
Figure 5
Elevated fibrinogen increases clot stability. (A) Human PRP and PPP prepared from CTI-inhibited whole blood were spiked with fibrinogen (to 6 mg/mL final, 200%) or BSA, recalcified, and clotted with TF (“Clot viscoelastometry”). Bars represent peak CEM (mean ± SD). (B-D) Recalcified human NPP spiked with fibrinogen or control was added to confluent cell monolayers. Fibrin polymerization was initiated in the presence of tPA; clotting and lysis were measured by turbidity at 405 nm. (B-D) Representative turbidity curves with human NPP and unstimulated HSVECs (B), SMCs (C), and TNF-α-HSVECs (D). Symbols are as follows: 3 mg/mL (○), 4.5 mg/mL (●), 6 mg/mL (■), and 7.5 mg/mL (♦) fibrinogen, final. (E) Time to peak turbidity and (F) peak turbidity (mean ± SD, n = 4), respectively. *P < .05 vs 3 mg/mL fibrinogen on HSVECs. #P < .05 vs 3 mg/mL within each cell type. (G) Recalcified murine PPP was spiked with human fibrinogen or HBS to achieve 2.4 mg/mL (○), 4.4 mg/mL (♦), or 6.4 mg/mL (▴) fibrinogen, final, diluted 1:3 in HBS, and clotting was initiated with TF (Innovin 1:30 000 final) and monitored by turbidity. Data are representative polymerization curves (n = 2). (H) Representative elastometry curves (n = 3) of human PRP and PPP prepared from CTI-inhibited whole blood, spiked with human fibrinogen (to 6 mg/mL, final) or BSA, recalcified, and clotted with TF in the presence of tPA (“Clot formation and lysis by turbidity”). The longer initiation phase of PRP clots versus PPP clots reflects the time to platelet activation.
Figure 6
Figure 6
Hyperfibrinogenemia increases resistance to thrombolysis in vivo. Thrombosis was triggered in the carotid artery of wild-type mice infused with fibrinogen (plasminogen-, fibronectin-, VWF-, and factor XIII-depleted, concentrations indicated in the figure) or vehicle control. After stable occlusion for 5 minutes, mice were infused with TNKase (concentrations indicated in the figure). Blood flow was monitored by flow probe throughout the experiment. Each panel shows data from an individual mouse, representative of at least 2 mice for each condition. Shaded grey area represents the time of FeCl3 treatment plus time to reacquire flow.

Comment in

Similar articles

Cited by

References

    1. Lindahl B, Toss H, Siegbahn A, Venge P, Wallentin L. Markers of myocardial damage and inflammation in relation to long-term mortality in unstable coronary artery disease: FRISC Study Group. N Engl J Med. 2000;343(16):1139–1147. - PubMed
    1. Danesh J, Lewington S, Thompson SG, et al. Plasma fibrinogen level and the risk of major cardiovascular diseases and nonvascular mortality: an individual participant meta-analysis. JAMA. 2005;294(14):1799–1809. - PubMed
    1. Wilhelmsen L, Svardsudd K, Korsan-Bengtsen K, Larsson B, Welin L, Tibblin G. Fibrinogen as a risk factor for stroke and myocardial infarction. N Engl J Med. 1984;311(8):501–505. - PubMed
    1. Acevedo M, Pearce GL, Kottke-Marchant K, Sprecher DL. Elevated fibrinogen and homocysteine levels enhance the risk of mortality in patients from a high-risk preventive cardiology clinic. Arterioscler Thromb Vasc Biol. 2002;22(6):1042–1045. - PubMed
    1. van Hylckama Vlieg A, Rosendaal FR. High levels of fibrinogen are associated with the risk of deep venous thrombosis mainly in the elderly. J Thromb Haemost. 2003;1(12):2677–2678. - PubMed

Publication types

MeSH terms