. 2011 Jul 14;118(2):425-36.
doi: 10.1182/blood-2010-07-296921. Epub 2011 Feb 25.

The dominant negative β isoform of the glucocorticoid receptor is uniquely expressed in erythroid cells expanded from polycythemia vera patients

Affiliations

The dominant negative β isoform of the glucocorticoid receptor is uniquely expressed in erythroid cells expanded from polycythemia vera patients

Lilian Varricchio et al. Blood. .

Abstract

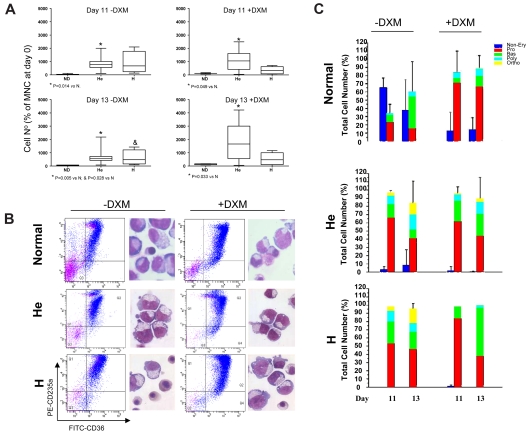
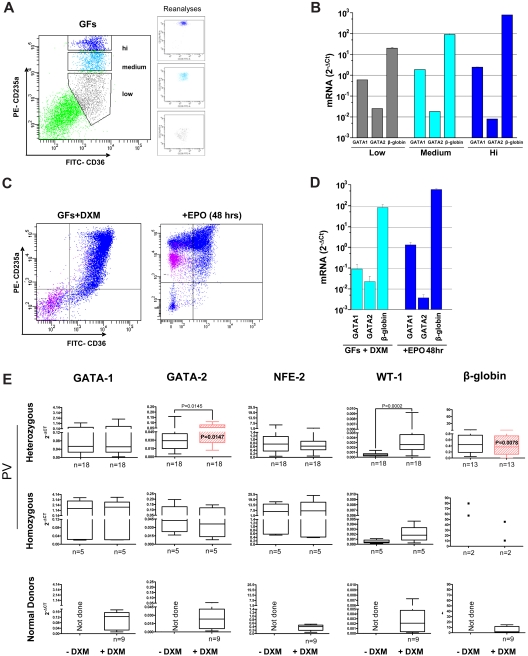
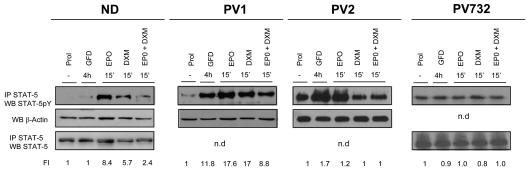
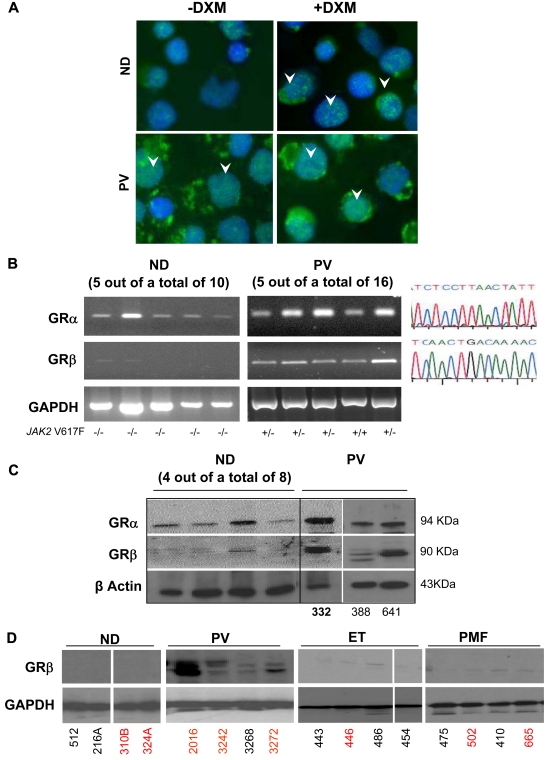
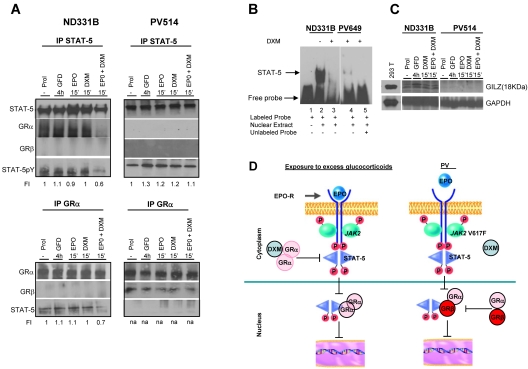
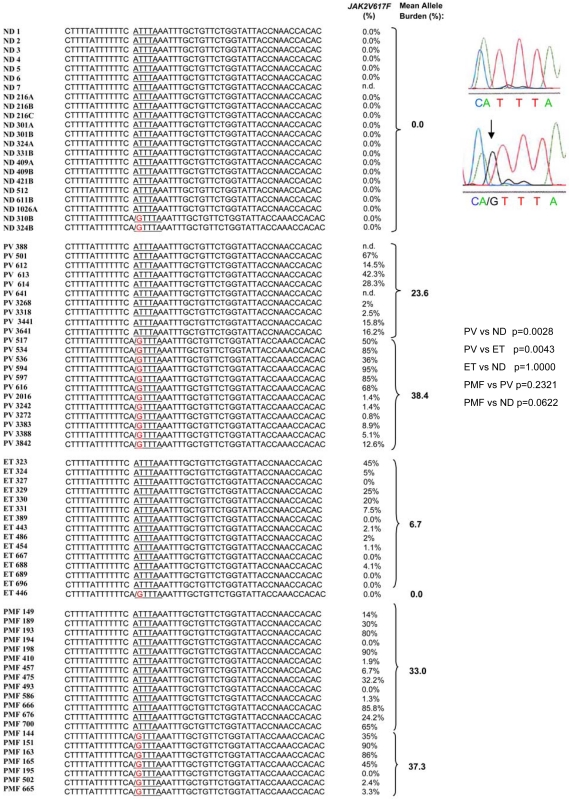
Glucocorticoid receptor (GR) agonists increase erythropoiesis in vivo and in vitro. To clarify the effect of the dominant negative GRβ isoform (unable to bind STAT-5) on erythropoiesis, erythroblast (EB) expansion cultures of mononuclear cells from 18 healthy (nondiseased) donors (NDs) and 16 patients with polycythemia vera (PV) were studied. GRβ was expressed in all PV EBs but only in EBs from 1 ND. The A3669G polymorphism, which stabilizes GRβ mRNA, had greater frequency in PV (55%; n = 22; P = .0028) and myelofibrosis (35%; n = 20) patients than in NDs (9%; n = 22) or patients with essential thrombocythemia (6%; n = 15). Dexamethasone stimulation of ND cultures increased the number of immature EBs characterized by low GATA1 and β-globin expression, but PV cultures generated great numbers of immature EBs with low levels of GATA1 and β-globin irrespective of dexamethasone stimulation. In ND EBs, STAT-5 was not phosphorylated after dexamethasone and erythropoietin treatment and did not form transcriptionally active complexes with GRα, whereas in PV EBs, STAT-5 was constitutively phosphorylated, but the formation of GR/STAT-5 complexes was prevented by expression of GRβ. These data indicate that GRβ expression and the presence of A3669G likely contribute to development of erythrocytosis in PV and provide a potential target for identification of novel therapeutic agents.


Figures

Figure 1
Figure 1
Dexamethasone increases the numbers of EBs generated in cultures of NDs but not of PV patients. Numbers (at days 11 and 13; A) and representative maturation profiles and morphology (at day 13; B) of EBs generated in liquid cultures stimulated with growth factors with or without dexamethasone (DXM) by MNCs from NDs or from PV patients homozygous (H; n = 3) or heterozygous (He; n = 13) for the JAK2V617F mutation. Magnification ×40. Forward-scatter/side-scatter analyses and propidium iodide staining were comparable (∼ 10%-15% propidium iodide–positive cells) in all cultures analyzed and are not shown. P values are provided when differences between ND and PV were statistically significant. Statistical analyses of the FACS profiles are presented in Table 2. Differential counts of cultured cells (by morphology) are presented in panel C. The different populations are color coded: blue for non-EBs; red for Pro-EBs; and green, blue, and yellow for basophilic (Bas), polychromatic (Poly), and orthochromatic (Ortho) EBs, respectively.
Figure 2
Figure 2
EBs generated ex vivo by MNCs of PV patients with or without dexamethasone express levels of GATA1, NF-E2, and WT1 similar to those expressed by EBs generated by MNCs from NDs with dexamethasone. Maturation profiles (by FACS analysis for CD36/CD235a expression; A,C) and gene expression profile (GATA1, GATA2, and β-globin; B,D) of EBs obtained from NDs in the presence of growth factors (GFs) without (A-B) or with (C-D) dexamethasone (DXM). Because of the great contamination from non-EBs (> 50%; Figure 1C and Table 1), EBs generated in the absence of DXM were purified by sorting into classes of progressively more mature populations on the basis of CD235a expression (CD235alow, CD235amedium, and CD235ahigh), and gene expression by individual populations was compared. Erythroblasts obtained in the presence of GFs plus DXM were analyzed before and after induction of maturation with erythropoietin (EPO) for 48 hours. Expression levels are expressed as 2−ΔCt and are presented as mean ± SD of at least 3 separate experiments. (E) Levels of GATA1, GATA2, NF-E2, WT1, and β-globin expressed by EBs generated by heterozygous (top panels) and homozygous (middle panels) PV patients and by NDs (bottom panels) with and without DXM. Because of the heterogeneity of their cell composition, samples from NDs cultured without DXM were not included in the analyses. Expression levels are presented as 2−ΔCt and as mean ± SD of different experiments. If differences were significant, P values are provided. Erythroblasts obtained from heterozygous PV patients with DXM expressed levels of GATA2 and β-globin significantly different from those expressed by EBs obtained from NDs with DXM and are indicated in red. The numbers of experiments included in each group are indicated by n.
Figure 3
Figure 3
Constitutive phosphorylation and nuclear translocation of STAT-5 in EBs generated ex vivo from PV patients. Levels of STAT-5 phosphorylation in cell extracts of EBs obtained in HEMA culture (Prol) from 1 ND and 3 PV patients and in cultures deprived of growth factor for 4 hours (GFD) and then treated with erythropoietin (EPO; 3 U/mL) and dexamethasone (DXM; 10−6M), alone or in combination, as indicated. STAT-5 phosphorylation was analyzed by WB of cell extracts immunoprecipitated (IP) with anti–STAT-5 antibody. The cell lysates were then analyzed by WB for β-actin and/or STAT-5 as quantitative control. The intensity of the signal was quantified by densitometry and expressed as a ratio (FI indicates fold increase) with the signal from cells in Prol. Similar data on STAT-5 phosphorylation of EBs from 10 additional NDs were reported previously.
Figure 4
Figure 4
Constitutive nuclear localization of GR in EBs generated ex vivo from PV MNCs is associated with expression of the dominant negative GRβ isoform. (A) Immunostaining for GR of EBs obtained from 1 representative ND and PV patient with and without dexamethasone (DXM). Arrowheads indicate representative nuclear localization of GR. In EBs from ND, nuclear staining for GR was observed after DXM stimulation and had the punctuated appearance expected for GRα. By contrast, in EBs from PV, GR staining of the nucleus had a diffuse DXM-independent pattern characteristic of GRβ. Magnification ×40. (B) RT-PCR analyses for expression of GRα and GRβ of EBs expanded ex vivo from 5 representative ND and PV patients. The homozygous (+/+) or heterozygous (+/−) allele status of the JAK2V617F mutation of the PV patients is indicated on the bottom. Similar results were obtained with additional NDs (n = 5) and PV patients (n = 11; not shown). In all cases, the identity of the band was confirmed by sequencing (on the right). GAPDH was amplified as control. (C) WB analyses with GRα- and GRβ-specific antibodies of EBs generated from 8 additional NDs (not analyzed at the mRNA level) and from 3 PV patients (the first patient was analyzed at the mRNA level in the second lane in panel B). β-actin was analyzed as a loading control. The proteins recognized by the GRα- and GRβ-specific antibodies migrated with an apparent molecular weight of 94 and 90 kDa, respectively. (D) WB analyses for GRβ of MNCs from NDs and from PV, ET, and PMF patients (4 each). Data are representative of those observed in a total of 10 subjects per group. In panels C and D, ND and MPN patients are identified by the same unique alphanumeric codes used in Figure 6. SNP-negative and SNP-positive subjects are indicated in black and red fonts, respectively. The SNP status of PV332 (in bold) is not known.
Figure 5
Figure 5
Both ND EBs exposed to excess glucocorticoids (by costimulation with erythropoietin and glucocorticoids) and PV EBs expressing the dominant negative GRβ isoform exhibit impaired functional GR/STAT-5 nuclear interaction. Erythroblasts were generated at day 10 of HEMA (Prol) and analyzed either as such or after growth factor deprivation for 4 hours (GFD) followed by treatment with erythropoietin (EPO; 3 U/mL) and dexamethasone (DXM; 10−6M), alone or in combination. (A) Erythroblasts obtained from 1 ND and 1 PV patient were immunoprecipitated (IP) with either STAT-5– or GRα-specific antibodies and the immunoprecipitations were analyzed by WB with either anti–STAT-5 or anti-GRα, as loading control, or with anti–STAT-5pY and anti-GRβ antibody. Similar results were obtained in 3 additional experiments, each with a separate donor. (B) EMSA with STAT-5–specific labeled probes of nuclear extract of EBs from 1 ND and 1 PV patient with (+) and without (−) DXM for 24 hours. Lane 1 is labeled probe only; lane 2, labeled probe with ND EBs without DXM; lane 3, labeled probe with ND EBs treated with DXM; lane 4, labeled probe with PV EBs treated with DXM; and lane 5, labeled probes with PV EBs that competed with excessive unlabeled probe. The position of the STAT-5–bound and –free probe is indicated by arrows. Similar results were obtained in 3 additional experiments. (C) WB analyses for GILZ and GAPDH (as loading control) expression of EBs generated at day 10 of HEMA (Prol) from ND or PV as indicated and analyzed either as such (Prol) or after growth factor deprivation for 4 hours (GFD) followed by treatment with erythropoietin (EPO; 3 U/mL) and DXM (10−6M), alone or in combination. Similar results were obtained in 3 additional experiments, each with a separate donor. Murine 293T cells overexpressing GILZ were analyzed as positive control. (D) Proposed model for development of erythrocytosis because of inhibition of GR/STAT-5 interactions by exposure to excess glucocorticoids and expression of the dominant negative GRβ isoform. In patients chronically stimulated with glucocorticoids who express GRα only, costimulation with erythropoietin and dexamethasone impairs regulation of GR/STAT-5–responsive genes by inhibiting STAT-5 phosphorylation and formation of GR/STAT-5 tetrameric complexes (A) and reducing the DNA-binding activity of STAT-5 (B). In PV, STAT-5 is constitutively phosphorylated by JAK2V617F (A) but cannot form complexes with GRα because this protein is largely retained in the nucleus as GRβ heterodimer (B). Therefore, in PV EBs, the DNA-binding activity is reduced (B), and expression of GR/STAT-5–responsive genes, such as GILZ, is also defective (C).
Figure 6
Figure 6
Presence of the A3669G polymorphism in NDs and in patients with PV, ET, and PMF. Individual subjects are indicated by unique alphanumeric codes. The presence of the GTTTA SNP was determined by PCR genotyping and confirmed by sequencing. Representative sequences are presented on the right. P values for the frequencies of the polymorphism in different groups were calculated with Fisher exact test and are presented on the right. The JAK2V617F status of the patients is reported for comparison. There was no difference in the mean JAK2V617F allele burden between patients with and without the polymorphism (P = .85 and .66 for PV and PMF patients, respectively, by Wilcoxon rank sum test).

Similar articles

Cited by

References

    1. Adamson JW, Fialkow PJ, Murphy S, Prchal JF, Steinmann L. Polycythemia vera: stem-cell and probable clonal origin of the disease. N Engl J Med. 1976;295(17):913–916. - PubMed
    1. Baxter EJ, Scott LM, Campbell PJ, et al. Acquired mutation of the tyrosine kinase JAK2 in human myeloproliferative disorders. Lancet. 2005;365(8):1054–1061. - PubMed
    1. James C, Ugo V, Le Couedic JP, et al. A unique clonal JAK2 mutation leading to constitutive signalling causes polycythaemia vera. Nature. 2005;434(7037):1144–1148. - PubMed
    1. Levine RL, Wadleigh M, Cools J, et al. Activating mutation in the tyrosine kinase JAK2 in polycythemia vera, essential thrombocythemia, and myeloid metaplasia with myelofibrosis. Cancer Cell. 2005;7(4):387–397. - PubMed
    1. Constantinescu SN, Ghaffari S, Lodish HF. The erythropoietin receptor: structure, activation and intracellular signal transduction. Trends Endocrinol Metab. 1999;10(1):18–23. - PubMed

Publication types

MeSH terms