. 2011 Jun 2;117(22):6024-35.
doi: 10.1182/blood-2010-10-311589. Epub 2011 Feb 25.

Ischemic neurons prevent vascular regeneration of neural tissue by secreting semaphorin 3A

Affiliations

Ischemic neurons prevent vascular regeneration of neural tissue by secreting semaphorin 3A

Jean-Sébastien Joyal et al. Blood. .

Abstract

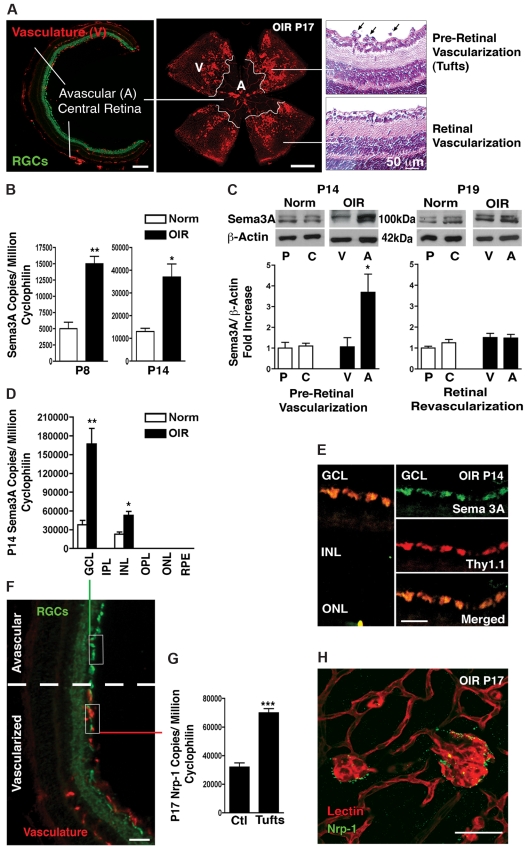
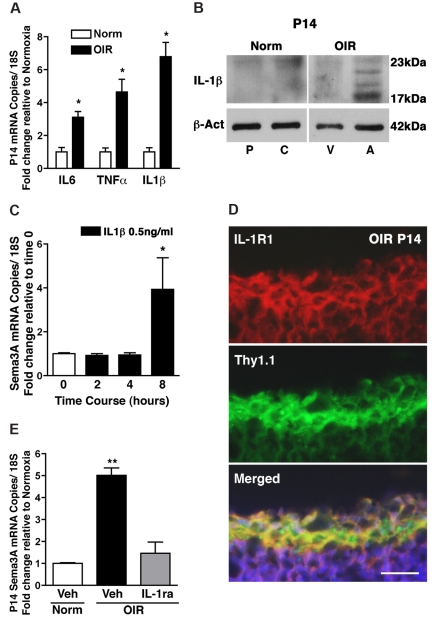
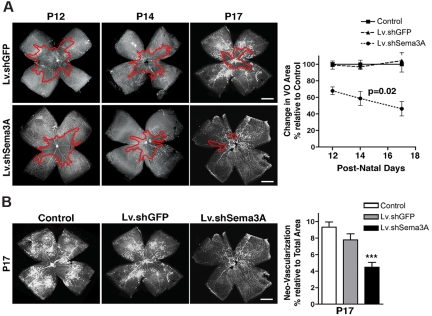
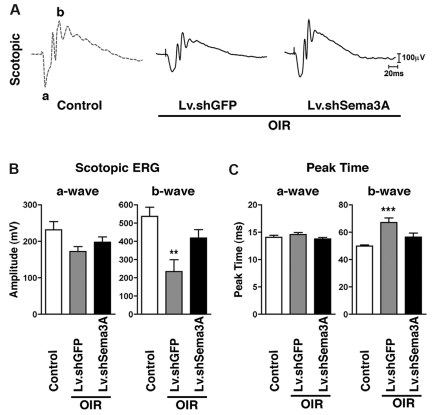
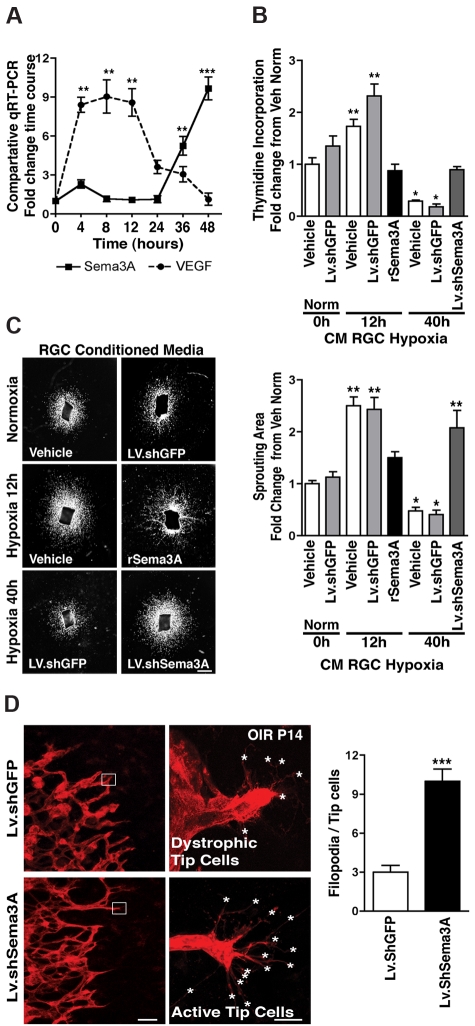
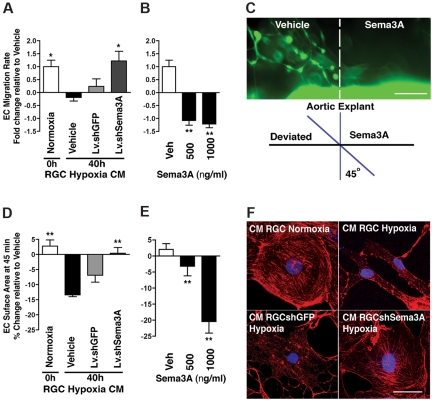
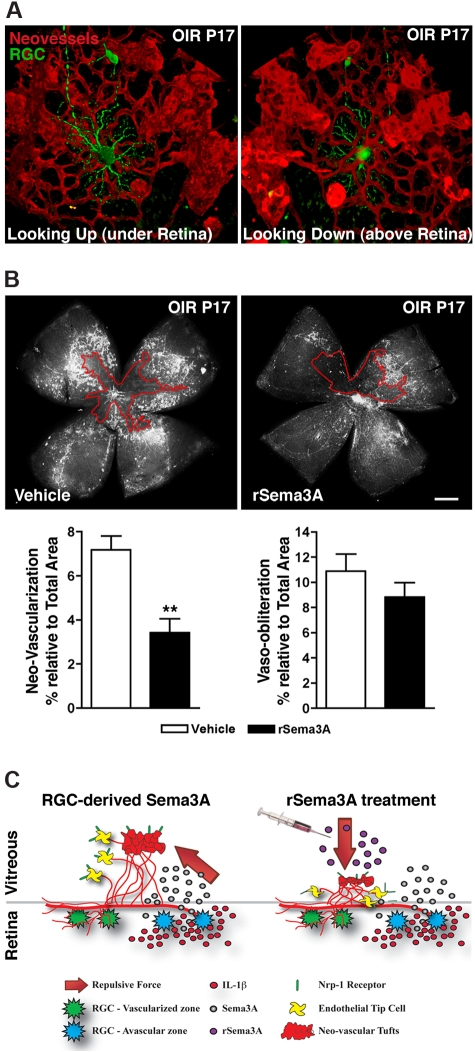
The failure of blood vessels to revascularize ischemic neural tissue represents a significant challenge for vascular biology. Examples include proliferative retinopathies (PRs) such as retinopathy of prematurity and proliferative diabetic retinopathy, which are the leading causes of blindness in children and working-age adults. PRs are characterized by initial microvascular degeneration, followed by a compensatory albeit pathologic hypervascularization mounted by the hypoxic retina attempting to reinstate metabolic equilibrium. Paradoxically, this secondary revascularization fails to grow into the most ischemic regions of the retina. Instead, the new vessels are misdirected toward the vitreous, suggesting that vasorepulsive forces operate in the avascular hypoxic retina. In the present study, we demonstrate that the neuronal guidance cue semaphorin 3A (Sema3A) is secreted by hypoxic neurons in the avascular retina in response to the proinflammatory cytokine IL-1β. Sema3A contributes to vascular decay and later forms a chemical barrier that repels neo-vessels toward the vitreous. Conversely, silencing Sema3A expression enhances normal vascular regeneration within the ischemic retina, thereby diminishing aberrant neovascularization and preserving neuroretinal function. Overcoming the chemical barrier (Sema3A) released by ischemic neurons accelerates the vascular regeneration of neural tissues, which restores metabolic supply and improves retinal function. Our findings may be applicable to other neurovascular ischemic conditions such as stroke.


Figures

Figure 1
Figure 1
Sema3A expression is consistent with a role in retinopathy. (A) Frozen cross-section (left panel) and flat-mount retinas (central panel) taken at P17 of OIR demonstrating the principal characteristics of PRs including avascular (A) and vascular (V) zones. Paraffin sections (right panel) demonstrating pre-retinal neovascular tufts (black arrows). (B) Real-time PCR on whole retinas taken at P8 and P14 demonstrates an ∼ 3-fold increase in Sema3A during the vaso-obliterative and neovascular phases of PRs, respectively (n = 3). Values are gene copy number normalized to CyclophilinA standards ± SEM. **P = .0015 and *P = .0157 compared with normoxia (Norm). (C) Microdissection of avascular regions of the OIR retina at P14 reveals a 3.5-fold induction in Sema3A protein levels in the avascular area (n = 3). Values are shown relative to vascularized areas ± SEM. *P = .0447 compared with the vascularized zone (V). At P19, when physiologic retinal revascularization is reinstated, Sema3A in the avascular retina returns to control levels. Levels of Sema3A in the peripheral (P) and central (C) retina of normoxic controls are comparable. (D) Laser capture microdissection on retinal layers (F) (also see supplemental Figure 1B) demonstrates that Sema3A is primarily produced in the ganglion cell layer (GCL), with lower expression in the inner nuclear layer (INL). ONL indicates outer nuclear layer. Levels of Sema3A surge 4.4-fold in the GCL at P14 after OIR (n = 3). **P = .0075 and *P = .0143 relative to normoxia (Norm). (E) Confocal imaging of immunohistochemistry on central avascular retinal cross-sections (OIR P14) reveals a predominant expression of Sema3A by RGCs as confirmed by merging with RGC marker Thy1.1. (G) At P17, laser capture microdissection and RT-PCR of normal vessels versus neovascular tufts revealed a 2.2-fold induction in Nrp-1 in tufts (n = 3). Values are gene copy number normalized to CyclophilinA standards ± SEM. ***P = .0007 compared with controls (Ctl). (H) Immunohistochemistry on flat-mount retinas confirms pronounced staining of Nrp-1 on lectin-stained neovascular tufts (P17). Images are representative of 5 experiments. Scale bars represent 300 μm (A right panel), 500 μm (A central panel), 50 μm (A right panel) 25 μm (E), 100 μm (F), and 25 μm (H).
Figure 2
Figure 2
IL-1β in the ischemic avascular retina induces Sema3A expression. (A) The inflammatory cytokines IL-6, TNF-α, and IL-1β are induced in OIR retinas, in particular IL-1β, which was up-regulated 6.8-fold compared with normoxia. n = 3; P < .01 compared with normoxia (Norm). (B) Microdissection of avascular (A) regions of the OIR retina reveals a marked induction in IL-1β (17 kDa) protein levels compared with the vascular regions (V) and the central (C) and peripheral (P) normoxic retina; higher molecular weight bands correspond to pro-IL-1β. n = 3; P < .01 compared with time 0. (C) RGC-5 stimulated with IL-1β (0.5 ng/mL) elicited a delayed (8 hours) but significant 4-fold increase in Sema3A (n = 3-4). (D) Confocal imaging of immunohistochemistry on retinal cross-sections (OIR P14) reveals a predominant expression of IL-1RI by RGCs, as confirmed by merging with RGC marker Thy1.1. (E) IL-1RI antagonist IL-1ra (Kineret) abrogated the OIR-dependent induction of Sema3A compared with vehicle-treated normoxia and OIR controls. Values are the fold increase of control ± SEM. n = 3; **P < .01 compared with normoxic vehicle (Veh). (D) Scale bar represents 25 μm.
Figure 3
Figure 3
RGC-derived Sema3A partakes in vaso-obliteration, hinders vascular regeneration, and contributes to preretinal neovascularization in OIR. (A) Representative photomicrographs of Griffonia simplicifolia lectin-stained flat-mount retinas at P12 reveal that mice receiving an intravitreal injection of Lv.shSema3A show a 32% reduction in the area of vaso-obliteration compared with contralateral eyes receiving Lv.shGFP injections and noninjected eyes (basal) revealing the vasotoxic properties of Sema3A in the first phase of OIR (n = 13-15; additional quantification is presented in supplemental Figure 4A). The inhibition of RGC-derived Sema3A significantly enhanced the rate of vascular regeneration secondary to OIR as determined at P12 (n = 13-15), P14 (n = 12-13), and P17 (n = 15-18). Values are presented as the rate change in vaso-obliterated areas relative to Lv.shGFP-treated controls ± SEM. P = .02 by ANOVA factoring for time and group. (B) At peak neovascularization (P17) lectin-stained flat-mount retinas reveal that inhibition of Sema3A (n = 9-12) significantly reduced areas of pathologic neovascularization from 9.3% to 4.5%, as determined using the SWIFT-NV quantification protocol (supplemental Figure 4B). Values are presented as areas of neovascularization relative to total retinal area ± SEM. ***P = .0002 compared with control. Scale bars in panels A and B represent 500 μm.
Figure 4
Figure 4
Inhibition of RGC-derived Sema3A during PR preserves neuroretinal function. (A) Representative recordings of full-field scotopic ERGs in response to progressively brighter flashes of white light ranging in intensity from −6.3 to 0.9 log cd/s/m2 in 0.3 log-unit increments (using a photostimulator with an interstimulus interval of 10 seconds, flash duration of 20 μs, and an average of 2-5 flashes). (B) Lv.shSema3A-treated mice show a significant gain in inner-retinal scotopic (mixed cone-rod) b-wave response (418.2 μV; n = 6) compared with control contra-lateral Lv.shGFP μV (234.3; n = 8) injected eyes. **P < .01 and ***P < .001 compared with corresponding controls. Similarly, knockdown of Sema3A enhances the response time to light stimulus, as illustrated by decreased peak times (56.4 ms) with respect to controls (67.1 ms). Inner retinal function as determined by a-wave amplitudes and peak times was not significantly affected.
Figure 5
Figure 5
Sema3A produced by hypoxic RGCs prevents retinal EC growth. (A) VEGF and Sema3A release by cultured RGC-5 cells exposed to hypoxia (2%). In the initial 12 hours after hypoxia, VEGF levels rapidly rise ∼ 9-fold, whereas Sema3A remains unaffected. Later, as hypoxic exposure is prolonged, Sema3A levels rise (6-fold at 36 hours and 10-fold at 48 hours). Values represent the fold increase relative to time 0. **P < .01 and ***P < .0001 compared with corresponding time 0. (B) Neuromicrovascular EC proliferation as measured by thymidine incorporation. Incubation of ECs with conditioned medium from RGCs exposed to hypoxia for 12 hours (high VEGF, low Sema3A) caused a 1.7-fold (vehicle) and 2.3-fold (nonspecific shRNA; LV.shGFP) increase in cell number within 24 hours; this effect was abrogated by rSema3A (800 ng/mL). Conversely, ECs treated with conditioned medium from RGCs exposed to hypoxia for 40 hours (low VEGF, high Sema3A), showed a Sema3A-dependent reduction in EC division (5-fold diminution). Knockdown of Sema3A in hypoxia-exposed RGCs using Lv.shSema3A prevented the decrease in EC division compared with vehicle- and Lv.shGFP-treated RGCs. n = 4-6; *P < .05 and **P < .01 compared with vehicle during normoxia (Norm) at time 0. (C) Aortic sprouting more than doubled in explants grown in conditioned medium from vehicle- and LV.shGFP-treated RGCs exposed to 12 hours of hypoxia; this vascular growth was curbed by rSema3A (800 ng/mL). Conditioned medium from RGCs exposed to 40 hours of hypoxia reduced their sprouting by ∼ 60% compared with normoxic medium controls. When Sema3A was knocked down in RGCs, vascular sprouting was doubled compared with Lv.shGFP, underscoring the inhibitory properties of Sema3A toward nascent vessels. Values are represented as the fold change relative to controls. n = 3-6; *P < .05 and **P < .01 compared with vehicle during normoxia (Norm) at time 0. (D) Representative confocal images of the revascularization front (images on left) and high magnification of tip cells (images on right) at OIR P14. The number of filopodia (asterisks) per tip cell was increased 3-fold in Lv.shSema3A animals, whereas contralateral eyes treated with Lv.shGFP showed fewer filopodia and dystrophic tip cells. n = 10; ***P < .0001 compared with value for Lv.shGFP. Scale bars represent 1 mm (C), 50 μm (D left), and 10 μm (D right).
Figure 6
Figure 6
Sema3A produced by hypoxic RGCs repels nascent vessels. (A) Rates of RBMEC migration using a real-time cell analyzer. EC motility was significantly blocked by hypoxia-induced Sema3A (4.2-fold) and rescued by conditioned medium from hypoxic RGC in which Sema3A was silenced (40 hours). n = 4; *P < .05 compared with vehicle at 40 hours of hypoxia. (B) Effect of rSema3A on EC migration rate (over 45 minutes). n = 3; **P < .01 compared with vehicle (Veh). (C) Propensity of Sema3A to deviate (repel) nascent vessels was established using microdeposited Sema3A adjacent to aortic explants from GFP mice. Vascular sprouts invaded vehicle-coated regions but avoided Sema3A-coated zones. (D) RGC-derived Sema3A modulates EC cytoskeletal arrangements and morphology, as demonstrated by time-lapse morphometric analysis of RBMECs subjected to conditioned medium (supplemental Figure 6B). ECs exposed for 45 minutes to conditioned medium from hypoxic RGCs (40 hours) contracted, whereas knockdown of Sema3A in the RGCs largely abrogated this effect. n = 3; **P < .01 compared with vehicle at 40 hours of hypoxia. (E) rSema3A provoked a dose-dependent cellular contraction (22.5%), similar in magnitude to 40 hours of hypoxic conditioned medium. n = 3; **P < .01 compared with vehicle (Veh). (F) Actin stress fibers in ECs. Treatment of ECs with hypoxic conditioned medium from hypoxic retinas resulted in loss of actin stress fibers and collapse of the actin network (as determined by rhodamine-phalloidin staining [red]); knockdown of Sema3A in RGCs abrogated this effect. Therefore, changes in actin are consistent with those on cell shape and movement (panels A-E). Images are representative of 4 experiments. Nuclei are stained with 4′,6-diamidino-2-phenylindole, dihydrochloride (blue). Scale bars represent 20 μm (C) and 50 μm (F).
Figure 7
Figure 7
Intravitreal delivery of rSema3A suppresses pre-retinal neovascularization in OIR. (A) 3D reconstructions of pathologic neo-vessels and RGC-YFP at P17 after OIR. The spatial distribution of retinal neurons and vessels results in the repulsion of neovascular tufts toward the vitreous. (B) Intravitreal injection of rSema3A (100 ng; P14) halved the formation of preretinal vascular tufts at P17. n = 7; **P = .0012 compared with corresponding vehicle. (C) Schematic summary illustrates ischemic neurons in the avascular zones, producing Sema3A secondary to inflammatory stress (IL-1β). Pathologic neovascular tufts are enriched in Nrp-1. RGC-derived Sema3A impedes revascularization and repels neo-vessels away from the avascular neural retina toward the vitreous (left), whereas intravitreal rSema3A (injected) prevents preretinal invasion of pathologic neovessels (right).

Comment in

References

    1. Sapieha P, Joyal J-S, Rivera JC, et al. Retinopathy of prematurity: understanding ischemic retinal vasculopathies at an extreme of life. J Clin Invest. 2010;120(9):3022–3032. - PMC - PubMed
    1. Stone J, Itin A, Alon T, et al. Development of retinal vasculature is mediated by hypoxia-induced vascular endothelial growth factor (VEGF) expression by neuroglia. J Neurosci. 1995;15(7 Pt 1):4738–4747. - PMC - PubMed
    1. Sapieha P, Sirinyan M, Hamel D, et al. The succinate receptor GPR91 in neurons has a major role in retinal angiogenesis. Nat Med. 2008;14(10):1067–1076. - PubMed
    1. Dorfman A, Dembinska O, Chemtob S, Lachapelle P. Early manifestations of postnatal hyperoxia on the retinal structure and function of the neonatal rat. Invest Ophthalmol Vis Sci. 2008;49(1):458–466. - PubMed
    1. Dorfman AL, Polosa A, Joly S, Chemtob S, Lachapelle P. Functional and structural changes resulting from strain differences in the rat model of oxygen-induced retinopathy. Invest Ophthalmol Vis Sci. 2009;50(5):2436–2450. - PubMed

Publication types

MeSH terms