

Frequency-specific electrocorticographic correlates of working memory delay period fMRI activity
- PMID: 21356314
- PMCID: PMC3085578
- DOI: 10.1016/j.neuroimage.2011.02.062
Frequency-specific electrocorticographic correlates of working memory delay period fMRI activity
Abstract
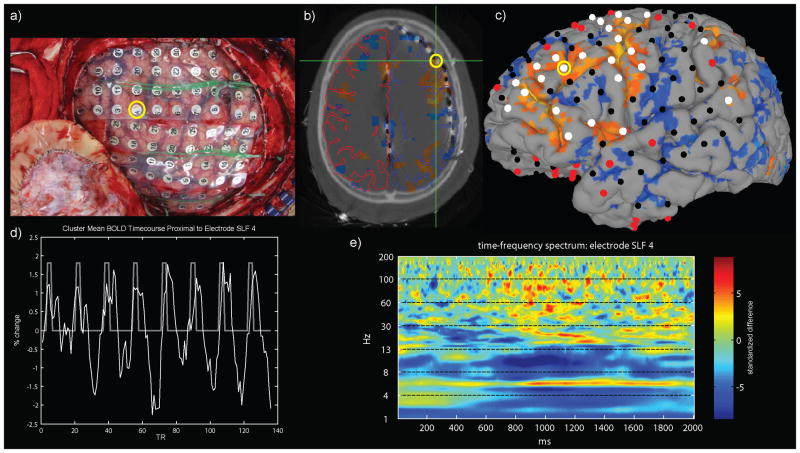
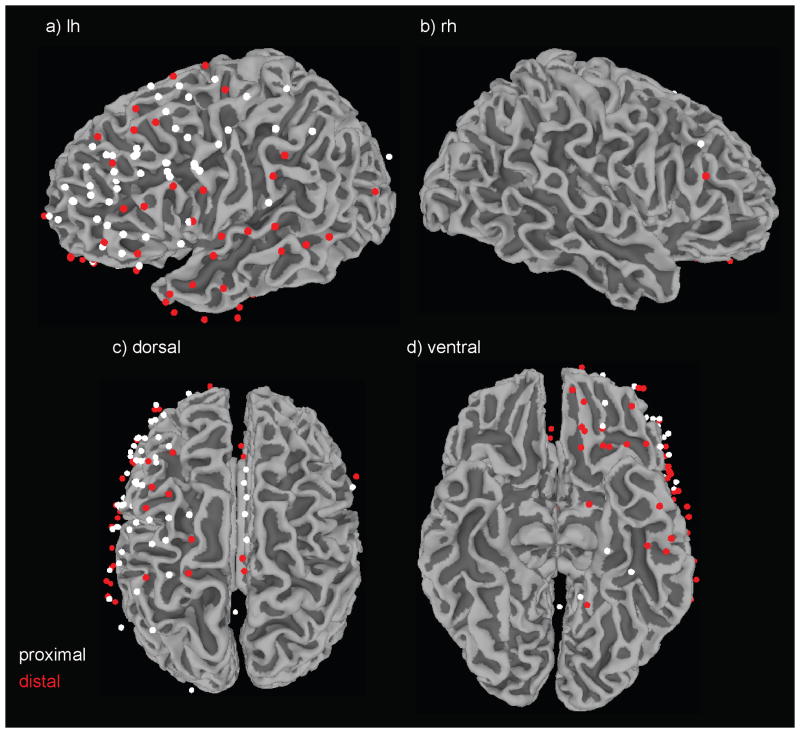
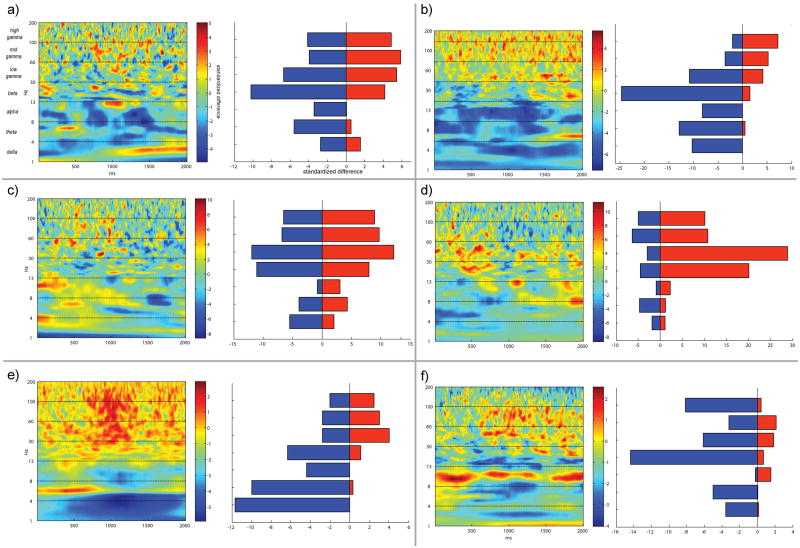
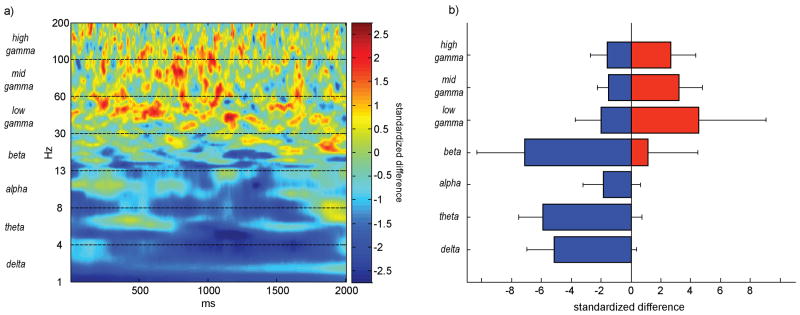
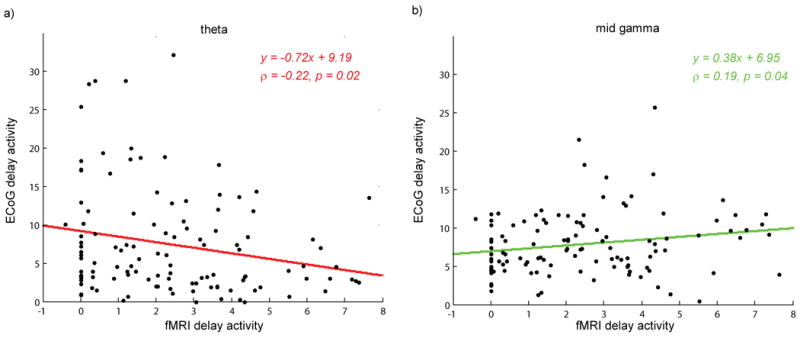
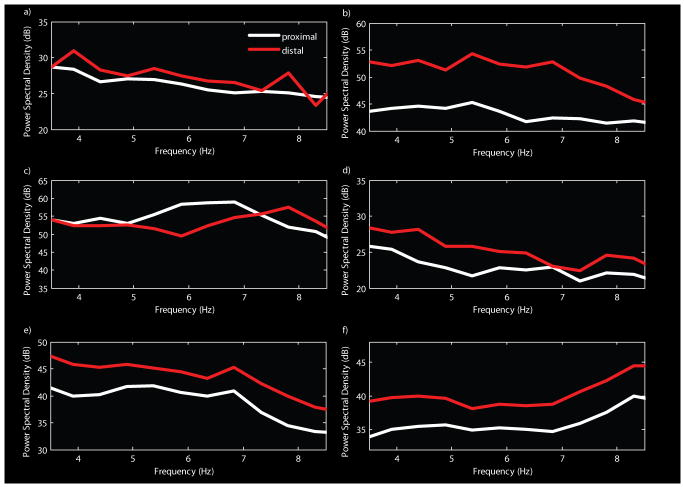
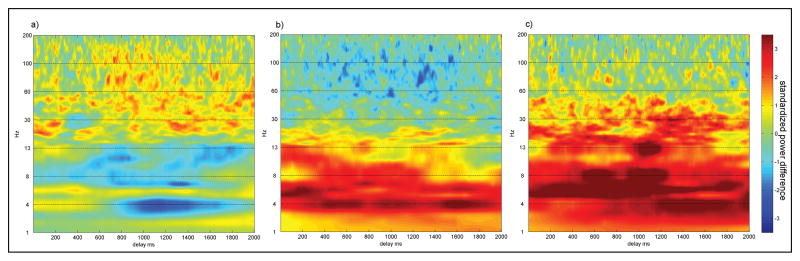
Electrocorticography (ECoG) and functional MRI (BOLD-fMRI) have been used previously to measure brain activity during working memory delay periods. These studies have separately reported oscillation changes in the theta (4-8 Hz) band and BOLD-fMRI increases during delay periods when information is maintained in memory. However, it is not known how intracranial cortical field potential (CFP) changes relate to BOLD-fMRI responses during delay periods. To answer this question, fMRI was obtained from six epilepsy patients during a visual working memory task. Then, following subdural macroelectrode implant, continuous ECoG was used to record CFPs during the same task. Time-frequency analyses showed delay period gamma band oscillation amplitude increases on electrodes located near fMRI activity, while in the theta band changes were higher for electrodes located away from fMRI activation. The amplitude of the ECoG gamma band response was significantly positively correlated with the fMRI response, while a negative correlation was found for the theta band. The findings are consistent with previous reports of local field potential (LFP) coupling in the gamma band with BOLD-fMRI responses during visual stimulation in monkeys, but are novel in that the relationship reported here persists after the disappearance of visual stimuli while information is being maintained in memory. We conclude that there is a relationship between BOLD-fMRI increases and human working memory delay period gamma oscillation increases and theta decreases. The spectral profile change provides a basis for comparison of working memory delay period BOLD-fMRI with field potential recordings in animals and other human intracranial EEG studies.
Copyright © 2010 Elsevier Inc. All rights reserved.
Figures
Similar articles
-
Variability of the relationship between electrophysiology and BOLD-fMRI across cortical regions in humans.J Neurosci. 2011 Sep 7;31(36):12855-65. doi: 10.1523/JNEUROSCI.1457-11.2011. J Neurosci. 2011. PMID: 21900564 Free PMC article.
-
Simultaneous EEG-fMRI during a working memory task: modulations in low and high frequency bands.PLoS One. 2010 Apr 22;5(4):e10298. doi: 10.1371/journal.pone.0010298. PLoS One. 2010. PMID: 20421978 Free PMC article.
-
Developmental changes of BOLD signal correlations with global human EEG power and synchronization during working memory.PLoS One. 2012;7(7):e39447. doi: 10.1371/journal.pone.0039447. Epub 2012 Jul 6. PLoS One. 2012. PMID: 22792176 Free PMC article.
-
Individual differences in EEG theta and alpha dynamics during working memory correlate with fMRI responses across subjects.Clin Neurophysiol. 2007 Nov;118(11):2419-36. doi: 10.1016/j.clinph.2007.07.023. Epub 2007 Sep 27. Clin Neurophysiol. 2007. PMID: 17900976 Free PMC article.
-
High-frequency gamma oscillations and human brain mapping with electrocorticography.Prog Brain Res. 2006;159:275-95. doi: 10.1016/S0079-6123(06)59019-3. Prog Brain Res. 2006. PMID: 17071238 Review.
Cited by
-
Epileptic discharges affect the default mode network--FMRI and intracerebral EEG evidence.PLoS One. 2013 Jun 28;8(6):e68038. doi: 10.1371/journal.pone.0068038. Print 2013. PLoS One. 2013. PMID: 23840805 Free PMC article.
-
The effect of workload on mind-wandering of drilling operators measured by electroencephalography (EEG).Exp Brain Res. 2024 Dec 20;243(1):29. doi: 10.1007/s00221-024-06974-w. Exp Brain Res. 2024. PMID: 39704838
-
FMRI of working memory impairment after recovery from subarachnoid hemorrhage.Front Neurol. 2013 Nov 6;4:179. doi: 10.3389/fneur.2013.00179. eCollection 2013. Front Neurol. 2013. PMID: 24223572 Free PMC article.
-
Artifact quantification and tractography from 3T MRI after placement of aneurysm clips in subarachnoid hemorrhage patients.BMC Med Imaging. 2011 Oct 4;11:19. doi: 10.1186/1471-2342-11-19. BMC Med Imaging. 2011. PMID: 21970560 Free PMC article.
-
Electrophysiological correlates of the BOLD signal for EEG-informed fMRI.Hum Brain Mapp. 2015 Jan;36(1):391-414. doi: 10.1002/hbm.22623. Epub 2014 Oct 3. Hum Brain Mapp. 2015. PMID: 25277370 Free PMC article. Review.
References
-
- Caplan JB, Madsen JR, Raghavachari S, Kahana MJ. Distinct patterns of brain oscillations underlie two basic parameters of human maze learning. J Neurophysiol. 2001;86:368–380. - PubMed
-
- Cohen MX, Ridderinkhof KR, Haupt S, Elger CE, Fell J. Medial frontal cortex and response conflict: evidence from human intracranial EEG and medial frontal cortex lesion. Brain Res. 2008;1238:127–142. - PubMed
Publication types
MeSH terms
Substances
Grants and funding
LinkOut - more resources
Full Text Sources
Medical
Miscellaneous
