. 2011 Mar;178(3):1145-52.
doi: 10.1016/j.ajpath.2010.11.059. Epub 2011 Jan 28.

Down-regulation of methylthioadenosine phosphorylase (MTAP) induces progression of hepatocellular carcinoma via accumulation of 5'-deoxy-5'-methylthioadenosine (MTA)

Affiliations

Down-regulation of methylthioadenosine phosphorylase (MTAP) induces progression of hepatocellular carcinoma via accumulation of 5'-deoxy-5'-methylthioadenosine (MTA)

Georgi Kirovski et al. Am J Pathol. 2011 Mar.

Abstract

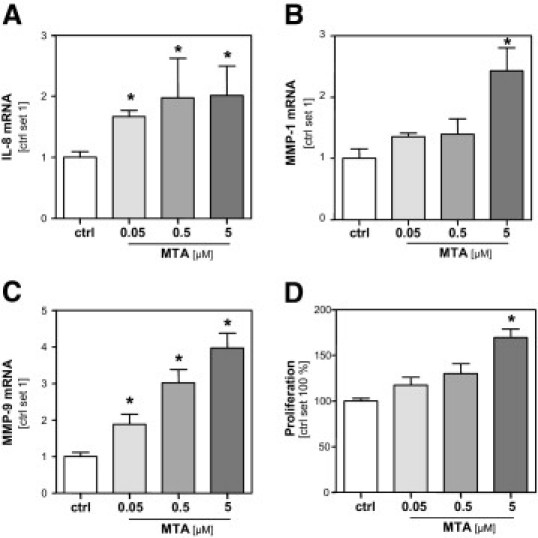
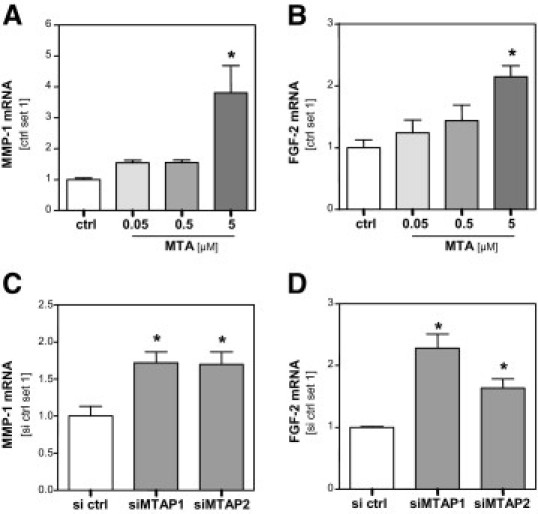
Recently, we have shown that down-regulation of methylthioadenosine phosphorylase (MTAP) in hepatocellular carcinoma (HCC) cells enhances the invasive potential and the resistance against cytokines. Here, we aimed at investigating the molecular mechanism underlying this tumor-promoting effect and expanded the analysis to a large series of human HCC tissues. Liquid chromatography tandem mass spectrometry revealed that reduced MTAP expression resulted in higher intra- and extracellular concentrations of 5'-deoxy-5'-methylthioadenosine (MTA) in cultivated HCC cells and, concordantly, higher levels of MTA in HCC tissue. MTA induced matrix metalloproteinase (MMP) and interleukin-8 transcription in HCC cells in vitro, accompanied by enhanced proliferation and activation of the transcription factor NFκB. In addition, MTA secreted by HCC cells induced expression of fibroblast growth factor-2 and MMP1 in stromal myofibroblasts. In human HCC tissues, MTAP mRNA correlated inversely with MTA levels, and immunohistochemical analysis of a tissue microarray of 140 human HCCs revealed that low MTAP protein expression correlated with advanced tumor stages. In conclusion, MTAP deficiency results in accumulation of MTA, which is associated with increased tumorigenicity. These data further indicate MTAP as a tumor suppressor in HCC, and MTA as a potential biomarker for HCC progression.


Figures

Figure 1
Figure 1
MTA concentration in human HCC cells and tissues. A: MTA levels in human HCC tissues (HCC) compared to adjacent nontumorous liver tissues (non-HCC). Fourteen paired samples were analyzed. MTA levels in cell lysates (B) and cell supernatants (C) of primary human hepatocytes (PHH) and the HCC cell lines PLC, HepG2, Hep3B, and Huh-7. Cells were cultured for 24 hours in FCS-free DMEM. D: MTAP mRNA (upper panel) and protein (Western blot, lower panel) expression in PLC cells, transiently transfected with negative control siRNA (si ctrl) or two different MTAP siRNAs (siMTAP1 and siMTAP2). The corresponding MTA levels in cell lysates (E) and supernatants (F) are depicted. G: MTA levels in cell lysates of PLC cell clones stably transfected with an MTAP expression plasmid (MTAP1 and MTAP2) and mock-transfected controls. *P ≤ 0.05 compared to non-HCC, PHH, si ctrl, or mock, respectively.
Figure 2
Figure 2
Effect of altered MTAP expression on HCC cells. Analysis of IL-8 (A–D), MMP-1 (B, E), and MMP-9 (C, F) mRNA expression in (i) PLC cells transiently transfected with negative control siRNA (si ctrl) or two different MTAP siRNAs (siMTAP1 and siMTAP2) (A–C) or (ii) PLC cell clones stably transfected with an MTAP expression plasmid (MTAP1 and MTAP2) and mock-transfected controls (D–F). *P ≤ 0.05 compared to si ctrl or mock, respectively.
Figure 3
Figure 3
Effect of MTA on HCC cells. Analysis of (A) IL-8, (B) MMP-1, and (C) MMP-9 mRNA expression of PLC cells after treatment (24 hours) with MTA at different concentrations (0.05, 0.5, and 5 μmol/L) and untreated control cells (ctrl). D: Proliferation MTA stimulated PLC cells in relation to growth of untreated control cells (set 100%). *P ≤ 0.05 compared to ctrl.
Figure 4
Figure 4
Effect of MTA on activated HSC. MMP1 (A) and FGF2 (B) mRNA expression in activated hepatic stellate cells (HSC) after treatment (24 hours) with MTA at different concentrations (0.05, 0.5, and 5 μmol/L) and untreated control cells (ctrl). MMP1 (C) and FGF2 (D) mRNA expression in HSC after stimulation (24 hours) with conditioned media derived from PLC cells in which MTAP expression was depleted by transfection with MTAP siRNA (siMTAP1 and siMTAP2) or from PLC cells transfected with control siRNA (si ctrl). *P ≤ 0.05 compared to ctrl or si ctrl, respectively.
Figure 5
Figure 5
Effect of MTA on NFκB activation and effect of diminished MTAP expression on S-adenosylmethionine levels in HCC cells. A: Effect of MTA treatment (0.5 and 5 μmol/L; 30 minutes) on IκB-α phosphorylation in PLC cells. Immunoreactive phospho-IkappBalpha (P-IκBα) was detected by Western blot analysis. Actin was analyzed on the same blot to demonstrate equal loading (bottom). B: Nuclear concentration of activated NFκB in MTA-treated (30 minutes) and control cells. S-adenosylmethionine (SAM) levels in cell lysates (C) and supernatants (D) of PLC cells, transiently transfected with negative control siRNA (si ctrl) or 2 different MTAP siRNAs (siMTAP1 and siMTAP2). *P ≤ 0.05 compared to ctrl.
Figure 6
Figure 6
MTAP expression in human HCC tissue. A: Representative MTAP immunohistochemical (IH) staining results of HCC tissue samples arranged on a tissue microarray (left panel: MTAP negative; right panel: MTAP positive). B: MTAP mRNA expression in 10 HCC tissues with negative and 15 HCC tissues with positive MTAP immunohistochemical staining (IH). *P ≤ 0.05 compared to MTAP IH negative. C: Correlation between MTA levels and MTAP mRNA expression in 19 human HCC tissue samples.

References

    1. Shariff M.I.F., Cox I.J., Gomaa A.I., Khan S.A., Gedroyc W., Taylor-Robinson S.D. Hepatocellular carcinoma: current trends in worldwide epidemiology, risk factors, diagnosis and therapeutics. Expert Rev Gastroenterol Hepatol. 2009;3:353–367. - PubMed
    1. Gomaa A.I., Khan S.A., Toledano M.B., Waked I., Taylor-Robinson S.D. Hepatocellular carcinoma: epidemiology, risk factors and pathogenesis. World J Gastroenterol. 2008;14:4300–4308. - PMC - PubMed
    1. Hussain K., El-Serag H.B. Epidemiology, screening, diagnosis and treatment of hepatocellular carcinoma. Minerva Gastroenterol Dietol. 2009;55:123–138. - PubMed
    1. Mendizabal M., Reddy K.R. Current management of hepatocellular carcinoma. Med Clin North Am. 2009;93:885–900. viii. - PubMed
    1. Yu M.C., Yuan J.M. Environmental factors and risk for hepatocellular carcinoma. Gastroenterology. 2004;127:S72–S78. - PubMed

Publication types

MeSH terms