. 2011 Mar 2;13(3):249-59.
doi: 10.1016/j.cmet.2011.02.005.

Transcriptional control of adipose lipid handling by IRF4

Affiliations

Transcriptional control of adipose lipid handling by IRF4

Jun Eguchi et al. Cell Metab. .

Abstract

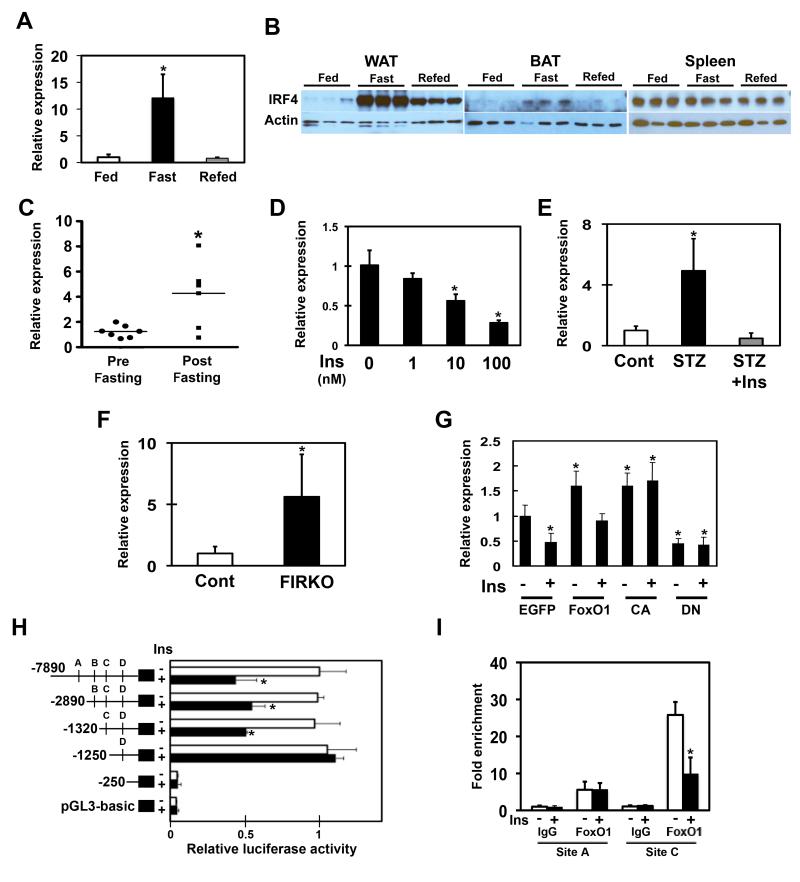
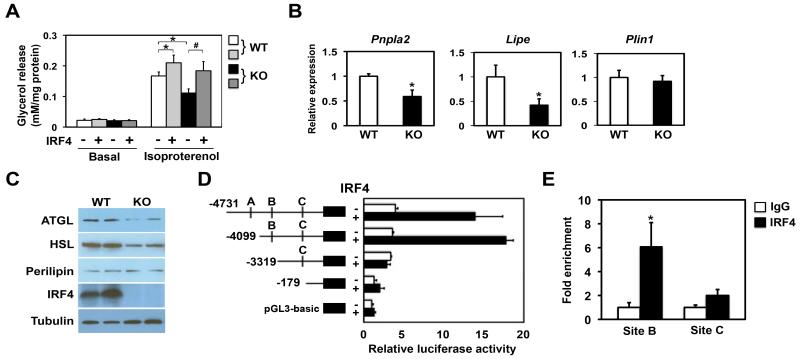
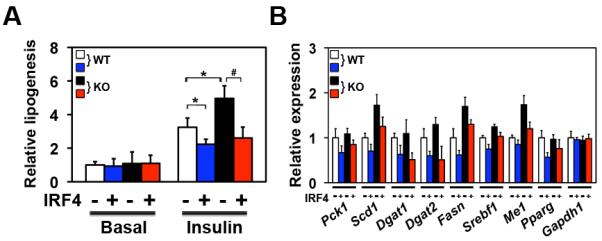
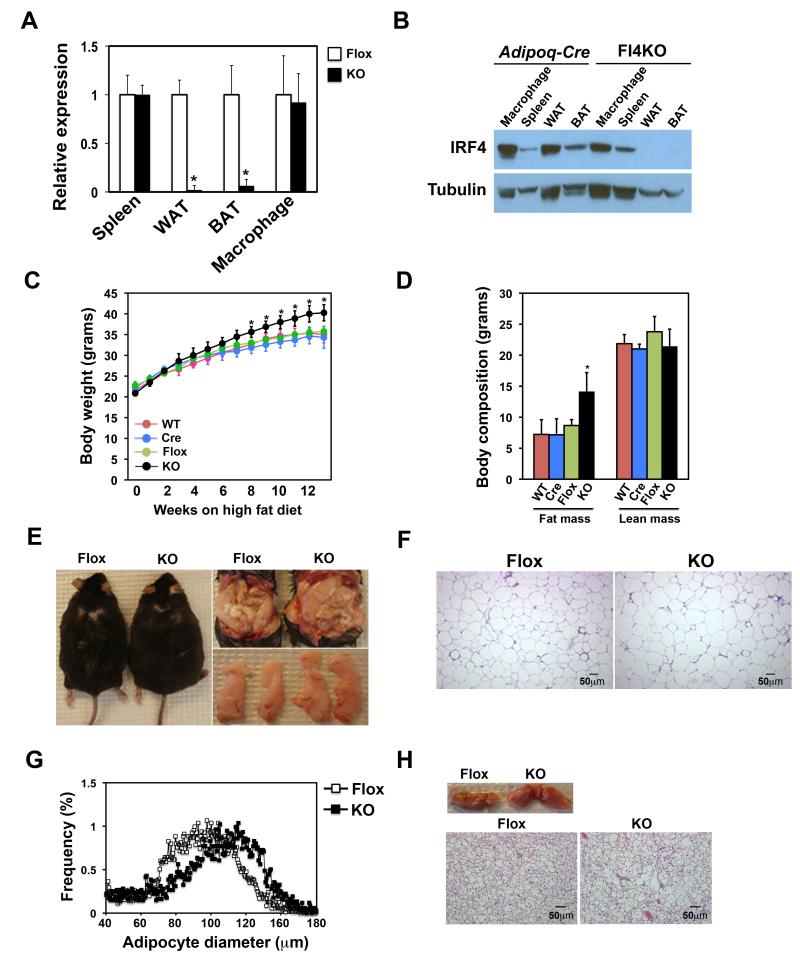
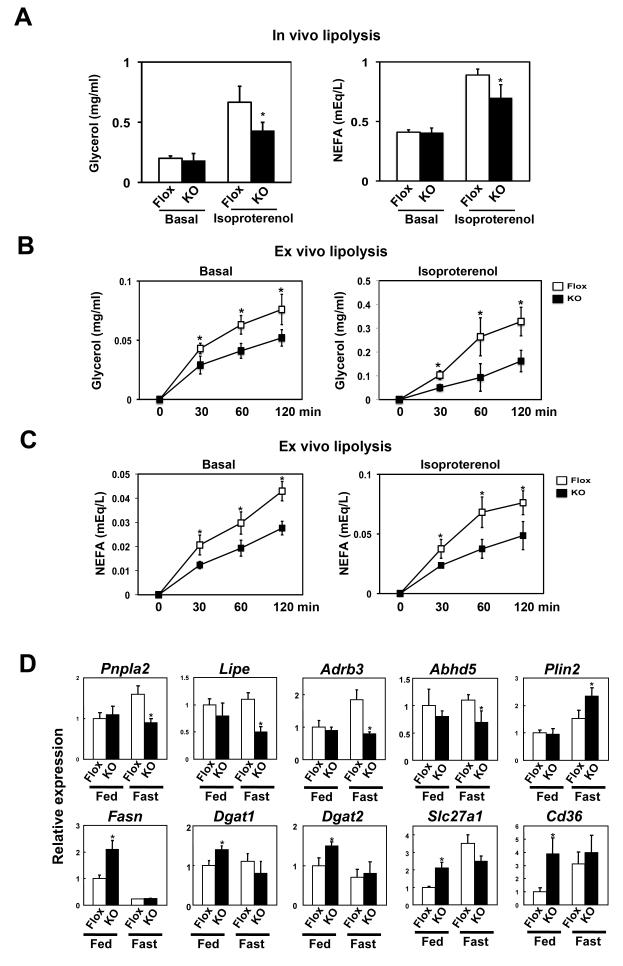
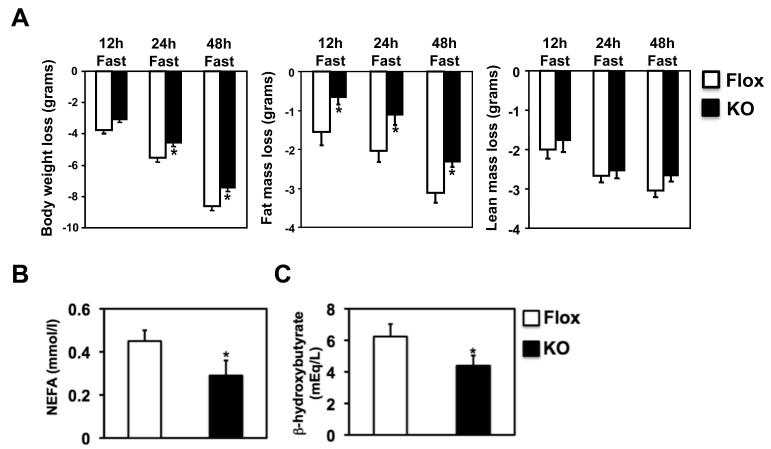
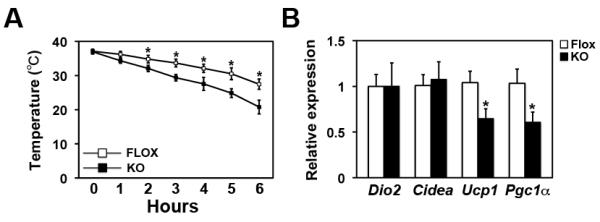
Adipocytes store triglyceride during periods of nutritional affluence and release free fatty acids during fasting through coordinated cycles of lipogenesis and lipolysis. While much is known about the acute regulation of these processes during fasting and feeding, less is understood about the transcriptional basis by which adipocytes control lipid handling. Here, we show that interferon regulatory factor 4 (IRF4) is a critical determinant of the transcriptional response to nutrient availability in adipocytes. Fasting induces IRF4 in an insulin- and FoxO1-dependent manner. IRF4 is required for lipolysis, at least in part due to direct effects on the expression of adipocyte triglyceride lipase and hormone-sensitive lipase. Conversely, reduction of IRF4 enhances lipid synthesis. Mice lacking adipocyte IRF4 exhibit increased adiposity and deficient lipolysis. These studies establish a link between IRF4 and the disposition of calories in adipose tissue, with consequences for systemic metabolic homeostasis.


Figures

Figure 1
Figure 1. IRF4 expression is regulated during fasting and feeding by insulin and FoxO1
A. Nutritional regulation of Irf4 mRNA expression in murine white adipose tissue (WAT). Male FVB mice were sacrificed in the fed state, after a 24hr fast, or 24hr after refeeding (n=7-8). Data are normalized to 36B4 expression and are expressed as fold induction relative to Irf4 mRNA in the fed state. Results expressed as mean ± SD. B. Nutritional regulation of IRF4 protein expression in murine WAT, brown adipose tissue (BAT), and spleen. C. IRF4 mRNA expression in human WAT, sampled pre and post-fasting (n=7). *p<0.05 versus pre fasting. D. Regulation of Irf4 mRNA expression by insulin in 3T3-L1 adipocytes. 3T3-L1 adipocytes were incubated in serum-free DMEM with insulin at the indicated doses for 8hrs (n=3). Data are normalized to 36B4 and presented as expression relative to 0nM insulin. *p<0.05 versus 0nM insulin. Results expressed as mean ± SD. E. Irf4 mRNA expression in WAT of streptozotocin (STZ)-treated mice. Irf4 mRNA expression was measured by Q-PCR in WAT of 10-week-old male mice given vehicle (control), STZ, or STZ followed by insulin replacement for 24h (STZ+Ins) (n=8-10/group). Data are normalized to 36B4 and presented as expression relative to control, *p<0.05. Results expressed as mean ± SD. F. Irf4 mRNA expression in WAT of Fat Insulin Receptor Knockout (FIRKO) mice (n=4/group). Data are normalized to 36B4 and presented as expression relative to control. Results expressed as mean ± SD. *p<0.05 versus control. G. Irf4 mRNA expression in 3T3-L1ΔCAR adipocytes transduced with adenovirus expressing EGFP, wild type (WT), constitutively active (CA), or dominant negative (DN) FoxO1. Data are normalized to 36B4 and presented as fold induction relative to EGFP cells. *p<0.05 versus EGFP cells. Results expressed as mean ± SD. H. Luciferase activity of Irf4 promoter constructs in 3T3-L1 adipocytes. Five days after adipogenic stimulation, 3T3-L1 cells were transfected with the indicated Irf4 promoter construct. Luciferase activity was measured 24 hr after transfection in the presence (filled bar) or absence (open bar) of insulin. Results are expressed as mean ± SD (n = 3). *p < 0.05 relative to the same construct without insulin. Results expressed as mean ± SD. I. ChIP assay of FoxO1 binding to Irf4 promoter constructs in 3T3-L1 adipocytes in the presence (filled bar) or absence (open bar) of insulin (n=3). All results normalized to IgG without insulin, and expressed as mean ± SD.
Figure 2
Figure 2. IRF4 promotes lipolysis in vitro via effects on lipase expression
A. Basal and isoproterenol-stimulated glycerol release (6-hour stimulation) in WT and KO MEFs, with and without the addition of exogenous IRF4. *p<0.05 (n=6), Results expressed as mean ± SD. B. Pnpla2, Lipe, and Plin1 mRNA expression in WT and KO MEFs. *p<0.05 relative to WT control (n=3). Results expressed as mean ± SD. C. ATGL, HSL, and PLIN1 protein expression in WT and KO MEFs. D. Luciferase activity of Pnpla2 promoter reporter constructs transfected into 3T3-L1 adipocytes. Five days after adipogenic stimulation, 3T3-L1 cells were co-transfected with the indicated promoter construct and an IRF4 expression plasmid (or control). Luciferase activity was measured 24 hr after transfection. Results are expressed as mean ± SD (n = 6). *p < 0.05 relative to EGFP. E. ChIP analysis in 3T3-L1 adipocytes overexpressing IRF4. The signal in IgG is set as 1. Results expressed as mean ± SD.
Figure 3
Figure 3. IRF4 inhibits lipogenesis in vitro
A. Insulin (100nM) stimulation of 14C glucose incorporation into lipid was determined in WT and KO MEFs, with and without the addition of exogenous IRF4. *p<0.05 (n=6), Results expressed as mean ± SD. from three independent experiments. *p<0.05 relative to WT control under insulin stimulation, #p<0.05 relative to KO MEF under insulin stimulation. B. WT and KO MEFs were transduced with lentivirus expressing IRF4 or EGFP 5 days after differentiation induction. mRNA expression of lipogenesis genes was measured using Q-PCR 7 days after infection. Results expressed as mean ± SD, n=6.
Figure 4
Figure 4. Characterization of Fat-specific IRF4 KO (FI4KO) mice
A. Irf4 mRNA expression in WAT, BAT, spleen, and peritoneal macrophages of male Irf4f/f (Flox) and FI4KO (KO) mice (n=3). Data are normalized to 36B4. *p<0.05 relative to Flox mice. Results are expressed as mean ± SD. B. IRF4 protein expression in WAT, BAT, spleen, and peritoneal macrophages of male Adipoq-Cre and FI4KO (KO) mice. C. Body weights of male WT, Adipoq-Cre, Flox, and FI4KO (KO) mice on high-fat diet (n=8-10). Results are expressed as mean ± SD. D. Body composition analysis in 14-week-old male mice (n=8-10) by MRI. Results are expressed as mean ± SD, *p<0.05 relative to Flox mice. E. Morphology of FI4KO (KO) mice (16 month old) and fat pads after high-fat feeding. F. Hematoxylin and eosin staining of paraffin-embedded epididymal WAT sections from 16-month-old mice. Scale bars = 50μm. G. Representative cell size distribution of adipocytes in epididymal WAT from Flox and FI4KO (KO) mice. H. Gross appearance and hematoxylin and eosin staining of paraffin-embedded BAT sections from 16-month-old mice. Scale bars = 50μm.
Figure 5
Figure 5. IRF4 is required for lipolysis in vivo and ex vivo
A. Lipolysis in Flox and FI4KO (KO) mice on chow diet. Glycerol and NEFA in plasma were measured in the absence and presence of 10μM of isoproterenol. Results are expressed as mean ± SD, * p<0.05, versus Flox mice (n=8). B, C. Rate of lipolysis in isolated adipocytes. Adipocytes were isolated from epididymal fat of male Flox and FI4KO (KO) mice. Glycerol and NEFA release were measured in the absence and presence of 10μM of isoproterenol. Results are expressed as mean ± SD, *p<0.05 relative to Flox mice (n=3). D. Q-PCR analysis of the indicated mRNAs in the adipocyte fraction of epididymal WAT from 12-week-old Flox or FI4KO (KO) mice on chow diet (n=5) under fed and 24h fasting conditions. All samples are normalized to 36B4. Results expressed as mean ± SD, * p<0.05, versus Flox mice.
Figure 6
Figure 6. FI4KO mice have an aberrant response to prolonged fasting
A. Response of FI4KO mice to prolonged fasting. Results are expressed as mean ± SD, *p<0.05 relative to Flox mice (n=9). B. NEFA levels after 48hr of fasting (n=9 mice per group; *p<0.05). C. β-hydroxybutyrate levels after 48hr of fasting (n=9 mice per group; *p<0.05). Data are expressed as mean ± SD.
Figure 7
Figure 7. FI4KO mice are cold intolerant
A. Rectal temperature of Flox and FI4KO (KO) mice during cold exposure (4°C). Results are expressed as mean ± SD, *p<0.05 relative to Flox mice (n=7 mice per group). B. Expression of Dio2, Cidea, Ucp1, and Pgc1α in BAT after cold exposure for 6 hr (n=7 mice per group; *p<0.05). Data are expressed as mean ± SD.

References

    1. Abel ED, Peroni O, Kim JK, Kim YB, Boss O, Hadro E, Minnemann T, Shulman GI, Kahn BB. Adipose-selective targeting of the GLUT4 gene impairs insulin action in muscle and liver. Nature. 2001;409:729–733. - PubMed
    1. Barlow C, Schroeder M, Lekstrom-Himes J, Kylefjord H, Deng CX, Wynshaw-Boris A, Spiegelman BM, Xanthopoulos KG. Targeted expression of Cre recombinase to adipose tissue of transgenic mice directs adipose-specific excision of loxP-flanked gene segments. Nucleic Acids Res. 1997;25:2543–2545. - PMC - PubMed
    1. Biggs WH, 3rd, Meisenhelder J, Hunter T, Cavenee WK, Arden KC. Protein kinase B/Akt-mediated phosphorylation promotes nuclear exclusion of the winged helix transcription factor FKHR1. Proc Natl Acad Sci U S A. 1999;96:7421–7426. - PMC - PubMed
    1. Bluher M. Adipose tissue dysfunction in obesity. Exp Clin Endocrinol Diabetes. 2009;117:241–250. - PubMed
    1. Bluher M, Michael MD, Peroni OD, Ueki K, Carter N, Kahn BB, Kahn CR. Adipose tissue selective insulin receptor knockout protects against obesity and obesity-related glucose intolerance. Dev Cell. 2002;3:25–38. - PubMed

Publication types

MeSH terms