. 2011 Jun 6;52(7):3926-33.
doi: 10.1167/iovs.10-7020.

Spatial localization of A2E in the retinal pigment epithelium

Affiliations

Spatial localization of A2E in the retinal pigment epithelium

Angus C Grey et al. Invest Ophthalmol Vis Sci. .

Abstract

Purpose: Lipofuscin, a fluorescent lysosomal pigment made of lipophilic molecules, is associated with age-related pathophysiological processes in the retinal pigment epithelium (RPE). The best-characterized components of lipofuscin are A2E and its oxides, but a direct spatial correlation with lipofuscin has not previously been possible.

Methods: Lipofuscin fluorescence was mapped across the RPE of Abca4(-/-) and Sv129 (background strain control) mice. In the same tissues, they determined the spatial distribution of A2E and its oxides by using the high molecular specificity of matrix-assisted laser desorption-ionization imaging mass spectrometry (MALDI-IMS). The fluorescence and tandem mass spectra taken directly from the tissue were compared with those of synthetic A2E standard.

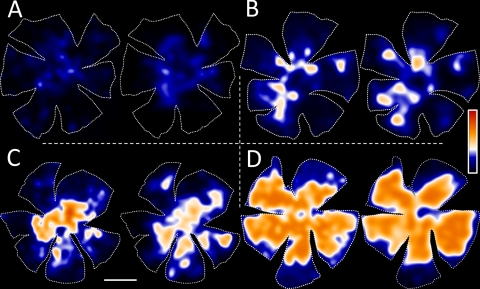
Results: In 2-month-old mice, A2E was found in the center of the retinal pigment epithelial tissue; with age, A2E increased across the tissue. With high levels of A2E, there was a marked correlation between A2E and lipofuscin, but with low levels this correlation diminished. The distributions of the oxidized forms of A2E were also determined. The amount of oxidation on A2E remained constant over 6 months, implying that A2E does not become increasingly oxidized with age in this time frame.

Conclusions: This report is the first description of the spatial imaging of a specific retinoid from fresh tissue and the first description of a direct correlation of A2E with lipofuscin. The molecule-specific imaging of lipofuscin components from the RPE suggests wide applicability to other small molecules and pharmaceuticals for the molecular characterization and treatment of age-related macular degeneration.


Figures

Figure 1.
Figure 1.
The chemical structure of A2E. Backbone fragmentation and the molecular weight of the resultant fragment ions are indicated. The highlight of m/z 418 shows that it is characteristically the most intense ion in the fragment spectrum (when compared with Figs. 2E and 2F).
Figure 2.
Figure 2.
Lipofuscin and A2E in mouse retinal pigment epithelial tissues. Summary mass spectra from retinal pigment epithelial tissues of 6-month-old Sv129 (A) and Abca4−/− mice (B). Consistent with the molecular weight of A2E, m/z 592 was a major signal in the spectra, which were normalized to a common signal at m/z 783. Insets: fluorescence micrographs from the RPE of the same animals (λexc = 488 nm, 20× objective) shown at the same intensity scaling. Scale bar, 50 μm. Fluorescence emission spectra of 100 μM synthetic A2E mixed into bovine rod outer segments containing 40 μM rhodopsin (C) and of lipofuscin from 6-month-old Sv129 retinal pigment epithelial tissue (D). The emission spectra (488 nm excitation, 20× objective) represent an average of 27 individual areas with lipofuscin accumulation. Tandem mass spectra recorded from a sample of synthetic A2E (E) and directly from matrix-coated 6-month-old Abca4−/− mouse retinal pigment epithelial tissue (F). The selected precursor ion for the MS/MS experiment was m/z 592.
Figure 3.
Figure 3.
Lipofuscin fluorescence and MALDI images of A2E in mouse RPE. RPE tissue images from 2-month-old Sv129 (A) and Abca4−/− (B) mice and 6-month-old Sv129 (C) and Abca4−/− (D) mice. Per panel, left: fluorescence intensity images; right: MALDI images of A2E in the same tissue. Fluorescence images were acquired as micrographs (λexc = 488 nm, 10× objective) of individual fields and joined by overlapping areas. Images are shown at the same intensity scaling. The MALDI images were acquired after the tissue was spotted with MALDI matrix at 150 μm resolution. The pixel intensity is proportional to A2E quantity, with the scale normalized to total ion current. All images are oriented as follows: dorsal (top); ventral (bottom); nasal (left, A, B; right, C, D); temporal (right, A, B; left, C, D). Left: 2-month-old animals are represented on the left and 6-month-old animals are represented on the right. Scale bar, 1 mm.
Figure 4.
Figure 4.
Visual correlation of lipofuscin and A2E in mouse RPE. Images from 2-month-old Sv129 (A), 2-month-old Abcr−/− (B), 6-month-old Sv129 (C), and 6-month-old Abca4−/− (D) mice. The figures were generated from the data shown in Figure 3 by removing the intensity interpolation from the MALDI images and remapping the fluorescence images to achieve the same resolution by pixel averaging. After intensity matching, the images were blurred with a 9-pixel filter. In each panel, the left image represents lipofuscin fluorescence intensity and the right image represents the MALDI image of A2E in the same tissue. Scale bar, 1 mm.
Figure 5.
Figure 5.
MALDI images of oxidized A2E in 6-month-old Abcr−/− mouse RPE. Singly oxidized A2E (m/z 608; A), doubly oxidized A2E (m/z 624; B), and triply oxidized A2E (m/z 640; C). Images were extracted from the same data set used to generate the A2E image seen in Figure 3D. Oxidation states higher than triply oxidized A2E were not detected. Scale bar, 1 mm.
Figure 6.
Figure 6.
Visual correlation of A2E oxides in 6-month-old Abca4−/− mouse RPE. Singly oxidized A2E (A), doubly oxidized A2E (B), and triply oxidized A2E (C). The figure represents MALDI images of A2E oxides and was generated from the data shown in Figure 5 by removing the intensity interpolation from the MALDI images. The resultant images were blurred with a 9-pixel filter. Scale bar, 1 mm.
Figure 7.
Figure 7.
A2E and A2E oxidation levels in mouse retinal pigment epithelial tissues. Mass spectrum from a 6-month-old Abca4−/− retinal pigment epithelial tissue (from Fig. 2B between 590 and 650 m/z). Isotopic envelopes for A2E and oxidized A2E are labeled and shown shaded. Inset: total A2E increases with age in both mouse strains (left). However, the amount of oxygen per A2E molecule was stable, and the oxidation profiles of the two strains were not significantly different (right). n = 8 in each condition. *P < 0.05.

References

    1. Wassell J, Davies S, Bardsley W, Boulton M. The photoreactivity of the retinal age pigment lipofuscin. J Biol Chem. 1999;274:23828–23832 - PubMed
    1. Delori FC, Dorey CK, Staurenghi G, Arend O, Goger DG, Weiter JJ. In vivo fluorescence of the ocular fundus exhibits retinal pigment epithelium lipofuscin characteristics. Invest Ophthalmol Vis Sci. 1995;36:718–729 - PubMed
    1. Feeney L. Lipofuscin and melanin of human retinal pigment epithelium: fluorescence, enzyme cytochemical, and ultrastructural studies. Invest Ophthalmol Vis Sci. 1978;17:583–600 - PubMed
    1. Roberts JE, Kukielczak BM, Hu DN, et al. The role of A2E in prevention or enhancement of light damage in human retinal pigment epithelial cells. Photochem Photobiol. 2002;75:184–190 - PubMed
    1. Winkler BS, Boulton ME, Gottsch JD, Sternberg P. Oxidative damage and age-related macular degeneration. Mol Vis. 1999;5:32. - PMC - PubMed

Publication types

MeSH terms