Molecular mechanism for adiponectin-dependent M2 macrophage polarization: link between the metabolic and innate immune activity of full-length adiponectin
- PMID: 21357416
- PMCID: PMC3075692
- DOI: 10.1074/jbc.M110.204644
Molecular mechanism for adiponectin-dependent M2 macrophage polarization: link between the metabolic and innate immune activity of full-length adiponectin
Abstract
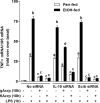
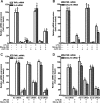
The anti-inflammatory effects of globular adiponectin (gAcrp) are mediated by IL-10/heme oxygenase 1 (HO-1)-dependent pathways. Although full-length (flAcrp) adiponectin also suppresses LPS-induced pro-inflammatory signaling, its signaling mechanisms are not yet understood. The aim of this study was to examine the differential mechanisms by which gAcrp and flAcrp suppress pro-inflammatory signaling in macrophages. Chronic ethanol feeding increased LPS-stimulated TNF-α expression by Kupffer cells, associated with a shift to an M1 macrophage polarization. Both gAcrp and flAcrp suppressed TNF-α expression in Kupffer cells; however, only the effect of gAcrp was dependent on IL-10. Similarly, inhibition of HO-1 activity or siRNA knockdown of HO-1 in RAW264.7 macrophages only partially attenuated the suppressive effects of flAcrp on MyD88-dependent and -independent cytokine signatures. Instead, flAcrp, acting via the adiponectin R2 receptor, potently shifted the polarization of Kupffer cells and RAW264.7 macrophages to an M2 phenotype. gAcrp, acting via the adiponectin R1 receptor, was much less effective at eliciting an M2 pattern of gene expression. M2 polarization was also partially dependent on AMP-activated kinase. flAcrp polarized RAW264.7 macrophages to an M2 phenotype in an IL-4/STAT6-dependent mechanism. flAcrp also increased the expression of genes involved in oxidative phosphorylation in RAW264.7 macrophages, similar to the effect of flAcrp on hepatocytes. In summary, these data demonstrate that gAcrp and flAcrp utilize differential signaling strategies to decrease the sensitivity of macrophages to activation by TLR4 ligands, with flAcrp utilizing an IL-4/STAT6-dependent mechanism to shift macrophage polarization to the M2/anti-inflammatory phenotype.
Figures


Similar articles
-
Adiponectin and heme oxygenase-1 suppress TLR4/MyD88-independent signaling in rat Kupffer cells and in mice after chronic ethanol exposure.J Immunol. 2010 Oct 15;185(8):4928-37. doi: 10.4049/jimmunol.1002060. Epub 2010 Sep 22. J Immunol. 2010. PMID: 20861358 Free PMC article.
-
The anti-inflammatory effects of adiponectin are mediated via a heme oxygenase-1-dependent pathway in rat Kupffer cells.Hepatology. 2010 Apr;51(4):1420-9. doi: 10.1002/hep.23427. Hepatology. 2010. PMID: 20052772 Free PMC article.
-
Adiponectin normalizes LPS-stimulated TNF-alpha production by rat Kupffer cells after chronic ethanol feeding.Am J Physiol Gastrointest Liver Physiol. 2006 May;290(5):G998-1007. doi: 10.1152/ajpgi.00553.2005. Epub 2006 Jan 12. Am J Physiol Gastrointest Liver Physiol. 2006. PMID: 16410364 Free PMC article.
-
Mechanisms for the anti-inflammatory effects of adiponectin in macrophages.J Gastroenterol Hepatol. 2008 Mar;23 Suppl 1:S50-3. doi: 10.1111/j.1440-1746.2007.05284.x. J Gastroenterol Hepatol. 2008. PMID: 18336664 Review.
-
Anti-inflammatory pathways and alcoholic liver disease: role of an adiponectin/interleukin-10/heme oxygenase-1 pathway.World J Gastroenterol. 2010 Mar 21;16(11):1330-6. doi: 10.3748/wjg.v16.i11.1330. World J Gastroenterol. 2010. PMID: 20238399 Free PMC article. Review.
Cited by
-
Female PAPP-A knockout mice are resistant to metabolic dysfunction induced by high-fat/high-sucrose feeding at middle age.Age (Dordr). 2015 Jun;37(3):9765. doi: 10.1007/s11357-015-9765-1. Epub 2015 May 8. Age (Dordr). 2015. PMID: 25953669 Free PMC article.
-
Globular Adiponectin Causes Tolerance to LPS-Induced TNF-α Expression via Autophagy Induction in RAW 264.7 Macrophages: Involvement of SIRT1/FoxO3A Axis.PLoS One. 2015 May 11;10(5):e0124636. doi: 10.1371/journal.pone.0124636. eCollection 2015. PLoS One. 2015. PMID: 25961287 Free PMC article.
-
Adiponectin Protects Hypoxia/Reoxygenation-Induced Cardiomyocyte Injury by Suppressing Autophagy.J Immunol Res. 2022 Oct 17;2022:8433464. doi: 10.1155/2022/8433464. eCollection 2022. J Immunol Res. 2022. PMID: 36300016 Free PMC article.
-
Heme Oxygenases in Cardiovascular Health and Disease.Physiol Rev. 2016 Oct;96(4):1449-508. doi: 10.1152/physrev.00003.2016. Physiol Rev. 2016. PMID: 27604527 Free PMC article. Review.
-
Analysis of Body Composition and Pain Intensity in Women with Chronic Pelvic Pain Secondary to Endometriosis.Rev Bras Ginecol Obstet. 2020 Aug;42(8):486-492. doi: 10.1055/s-0040-1713912. Epub 2020 Sep 8. Rev Bras Ginecol Obstet. 2020. PMID: 32898913 Free PMC article.
References
Publication types
MeSH terms
Substances
Grants and funding
LinkOut - more resources
Full Text Sources
Other Literature Sources
Research Materials
Miscellaneous

