. 2011 Apr;77(8):2772-84.
doi: 10.1128/AEM.02547-10. Epub 2011 Feb 25.

Population size drives industrial Saccharomyces cerevisiae alcoholic fermentation and is under genetic control

Affiliations

Population size drives industrial Saccharomyces cerevisiae alcoholic fermentation and is under genetic control

Warren Albertin et al. Appl Environ Microbiol. 2011 Apr.

Abstract

Alcoholic fermentation (AF) conducted by Saccharomyces cerevisiae has been exploited for millennia in three important human food processes: beer and wine production and bread leavening. Most of the efforts to understand and improve AF have been made separately for each process, with strains that are supposedly well adapted. In this work, we propose a first comparison of yeast AFs in three synthetic media mimicking the dough/wort/grape must found in baking, brewing, and wine making. The fermentative behaviors of nine food-processing strains were evaluated in these media, at the cellular, populational, and biotechnological levels. A large variation in the measured traits was observed, with medium effects usually being greater than the strain effects. The results suggest that human selection targeted the ability to complete fermentation for wine strains and trehalose content for beer strains. Apart from these features, the food origin of the strains did not significantly affect AF, suggesting that an improvement program for a specific food processing industry could exploit the variability of strains used in other industries. Glucose utilization was analyzed, revealing plastic but also genetic variation in fermentation products and indicating that artificial selection could be used to modify the production of glycerol, acetate, etc. The major result was that the overall maximum CO(2) production rate (V(max)) was not related to the maximum CO(2) production rate per cell. Instead, a highly significant correlation between V(max) and the maximum population size was observed in all three media, indicating that human selection targeted the efficiency of cellular reproduction rather than metabolic efficiency. This result opens the way to new strategies for yeast improvement.


Figures

Fig. 1.
Fig. 1.
Principal component analysis (PCA) of nine food processing S. cerevisiae strains in three synthetic media (brewery, bakery, and enology). Fermentations run in bakery, brewery, and enology media are represented by circles, squares, and diamonds, respectively. B1 and B2, D1 to D3, and E1 to E4 stand for brewery, distillery, and enology strains, respectively. PCA was made from the following variables: Vmax, lag-phase time, AF time, K, r, Jmax, CO2tot, ethanol, acetic acid, glycerol, glycogen, trehalose, nitrogen consumption, biomass, cell size, and growth recovery. x axis, percentage of variation explained by principal component 1 (PC1) (41.9%); y axis, percentage of variation explained by PC2 (27.9%).
Fig. 2.
Fig. 2.
Fermentation kinetics of nine food processing S. cerevisiae strains in three synthetic media (brewery, bakery, and enology). The food processing origin of the strain is indicated in parentheses; “dist” stands for distillery origin. CO2 production rate is expressed in g liter−1 h−1. In bakery and brewery media, all strains were able to complete fermentation (i.e., the residual sugar at the end of the fermentation was lower than 0.5 g liter−1). In enology medium, only the four wine strains displayed completed fermentation (mean residual sugar concentrations of 0.0, 0.0, 2.9, and 2.1 g liter−1 for E1, E2, E3, and E4, respectively), while beer and distillery strains displayed sluggish or stuck fermentation (residual sugar concentrations of 23.3, 37.2, 34.4, 7.3, and 102.8 g liter−1 for B1, B2, D1, D2, and D3, respectively). For figure visibility, only the first 250 h of fermentation in enology medium was represented.
Fig. 3.
Fig. 3.
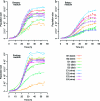
Population dynamics of nine food processing S. cerevisiae strains in three synthetic media (brewery, bakery, and enology). The food processing origin of the strain is indicated in parentheses; “dist” stands for distillery origin. Population size is expressed in number of cells per ml.
Fig. 4.
Fig. 4.
Percentages of glucose allocated to ethanol, biomass, glycerol, acetic acid, trehalose, and glycogen production during alcoholic fermentation of nine food processing S. cerevisiae strains in three synthetic media (brewery, bakery, and enology). Biomass was taken into account without glycogen and trehalose contents in glucose balance analysis and was approximated in glucose equivalents using the equation of Verduyn et al. (67). Variance analysis applied to glucose allocation data showed that all six fermentation products displayed significant medium effect. Strain and medium-by-strain effects were also found to be significant for all parameters but the proportion of glucose allocated to ethanol.
Fig. 5.
Fig. 5.
Relationships between Vmax, Jmax, and K. Fermentations run in bakery, brewery, and enology media are represented by circles, squares, and diamonds, respectively. B1 and B2, D1 to D3, and E1 to E4 stand for brewery, distillery, and enology strains, respectively. Significant correlation was found between Vmax and K (ρ = 0.48 and P < 0.05), while there was no relation between Vmax and Jmax (P > 0.1). Vmax was expressed in g liter−1 h−1, Jmax was expressed in g h−1 cell−1, and K was expressed in cells ml−1.
Fig. 6.
Fig. 6.
Relationships between K and trehalose, acetic acid, nitrogen consumption, and biomass. Symbols are the same as those in Fig. 5. Significant correlation was found between K and trehalose (ρ = −0.84, P < 0.001), K and acetic acid (ρ = −0.76, P < 0.001), K and nitrogen consumption (ρ = 0.82, P < 0.001), and K and biomass (ρ = 0.60, P < 0.01). K was expressed in cells ml−1, trehalose was expressed in g cell−1, acetic acid was expressed in g liter−1, nitrogen consumption was expressed as the percentage of initial nitrogen content consumed, and biomass was expressed in g liter−1.
Fig. 7.
Fig. 7.
Relationships between cell size, Jmax, K, growth recovery, and trehalose. Symbols are the same as those in Fig. 5. Significant correlations were found between cell size and Jmax (ρ = 0.65, P < 0.01), cell size and K (ρ = −0.69, P < 0.001), cell size and growth recovery (ρ = 0.58, P < 0.01), and cell size and trehalose (ρ = 0.70, P < 0.001). Jmax was expressed in g liter−1 h−1 cell−1, cell size was expressed in μm (mean diameter), K was expressed in cells ml−1, growth recovery was expressed as the frequency of cultivable cells, and trehalose was expressed in g cell−1.

Similar articles

Cited by

References

    1. Albertin W., et al. 2009. Evidence for autotetraploidy associated with reproductive isolation in Saccharomyces cerevisiae: towards a new domesticated species. J. Evol. Biol. 22:2157–2170 - PubMed
    1. Attfield P. V. 1997. Stress tolerance: the key to effective strains of industrial baker's yeast. Nat. Biotechnol. 15:1351–1357 - PubMed
    1. Bely M., Rinaldi A., Dubourdieu D. 2003. Influence of assimilable nitrogen on volatile acidity production by Saccharomyces cerevisiae during high sugar fermentation. J. Biosci. Bioeng. 96:507–512 - PubMed
    1. Bely M., Sablayrolles J. M., Barre P. 1990. Automatic detection of assimilable nitrogen deficiencies during alcoholic fermentation in enological conditions. J. Ferment. Bioeng. 70:246–252
    1. Bely M., Sablayrolles J. M., Barre P. 1990. Description of alcoholic fermentation kinetics—its variability and significance. Am. J. Enol. Vitic. 41:319–324

Publication types

LinkOut - more resources