. 2011 Jun;10(6):832-41.
doi: 10.1128/EC.00235-10. Epub 2011 Feb 25.

Mid1, a mechanosensitive calcium ion channel, affects growth, development, and ascospore discharge in the filamentous fungus Gibberella zeae

Affiliations

Mid1, a mechanosensitive calcium ion channel, affects growth, development, and ascospore discharge in the filamentous fungus Gibberella zeae

Brad Cavinder et al. Eukaryot Cell. 2011 Jun.

Abstract

The role of Mid1, a stretch-activated ion channel capable of being permeated by calcium, in ascospore development and forcible discharge from asci was examined in the pathogenic fungus Gibberella zeae (anamorph Fusarium graminearum). The Δmid1 mutants exhibited a >12-fold reduction in ascospore discharge activity and produced predominately abnormal two-celled ascospores with constricted and fragile septae. The vegetative growth rate of the mutants was ∼50% of the wild-type rate, and production of macroconidia was >10-fold lower than in the wild type. To better understand the role of calcium flux, Δmid1 Δcch1 double mutants were also examined, as Cch1, an L-type calcium ion channel, is associated with Mid1 in Saccharomyces cerevisiae. The phenotype of the Δmid1 Δcch1 double mutants was similar to but more severe than the phenotype of the Δmid1 mutants for all categories. Potential and current-voltage measurements were taken in the vegetative hyphae of the Δmid1 and Δcch1 mutants and the wild type, and the measurements for all three strains were remarkably similar, indicating that neither protein contributes significantly to the overall electrical properties of the plasma membrane. Pathogenicity of the Δmid1 and Δmid1Δcch1 mutants on the host (wheat) was not affected by the mutations. Exogenous calcium supplementation partially restored the ascospore discharge and vegetative growth defects for all mutants, but abnormal ascospores were still produced. These results extend the known roles of Mid1 to ascospore development and forcible discharge. However, Neurospora crassa Δmid1 mutants were also examined and did not exhibit defects in ascospore development or in ascospore discharge. In comparison to ion channels in other ascomycetes, Mid1 shows remarkable adaptability of roles, particularly with regard to niche-specific adaptation.


Figures
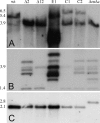
Fig. 1.
Fig. 1.
Southern analysis of G. zeae Mid1 deletion and complementation strains. (A) Hybridization of the MID1 probe. (B) Hybridization of the hph probe. (C) Hybridization of the CCH1 probe. The numbers to the left indicate the approximate size of bands in kilobases. For all figures, strain genotypes are as follows: wt (MID1 CCH1, Δ2 and Δ12 (Δmid1 CCH1), E1 (MID1 CCH1), C1 and C2 (Δmid1 CCH1::MID1), and ΔmΔc (Δmid1 Δcch1).
Fig. 2.
Fig. 2.
Growth of G. zeae strains on carrot agar and calcium-limited medium. (Top panel) Growth (day 4) on CA. wt, E1, C1, and C2 fully colonized the medium; the remaining strains (Δ2, Δ12, and ΔmΔc) did not. (Bottom panel) Growth (day 14) on medium supplemented to 1 mM BAPTA; the extent of growth is outlined by black dotted lines.
Fig. 3.
Fig. 3.
Effect of Ca2+ ionophore on G. zeae mycelial growth. (A and C) PH-1 and Δ2 controls, respectively. (B and D) PH-1 and Δ2 treated with A23187. The point of treatment is indicated by black dots; treatment was administered after 48 h of initial growth. Images were taken 72 h after treatment.
Fig. 4.
Fig. 4.
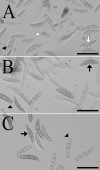
G. zeae ascospore morphology of mutant Δ2 (A), complemented strain C1 (B), and PH-1 (C). The white arrowhead indicates single cell fragments arising from two-celled abnormal ascospores. The white arrow indicates two-celled abnormal ascospores with restricted septae that may fragment. Black arrowheads point to emerging germination tubes. Black arrows indicate PH-1 four-celled ascospores. Bars, 20 μm.
Fig. 5.
Fig. 5.
Effect of mutation and Ca2+ supplementation on G. zeae ascospore discharge. Agar plugs supporting mature perithecia (across the bottom of each panel) from each strain were oriented perpendicular to the glass slides so that spores accumulated on the slides (black arrowhead for each panel). Pictured results represent unamended medium (top) and medium amended with Ca2+ (bottom).
Fig. 6.
Fig. 6.
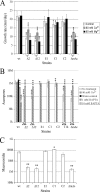
Characterization of G. zeae growth and development. (A) Growth rates on carrot agar with and without Ca2+ or Mg2+ supplementation. y axis values represent changes of diameter in millimeters/day. (B) Ascospore discharge rates. y axis values represent numbers of ascospore discharged. (C) Macroconidium production. y axis values represent numbers of macroconidia produced. Error bars represent the SD of the means of the results of 5 (A), 10 (B), or 3 (C) biological replicate experiments. Asterisks above open bars denote significant differences in the measurements of the indicated strains compared to PH-1 (wt). Asterisks below the bars denote significant differences in the measurements of the indicated strains between untreated and calcium-supplemented treatments for that strain. *, P < 0.05; **, P < 0.01; ***, P < 0.001. Strain genotypes are as listed shown in Fig. 1 except T14 (MID1 Δcch1).
Fig. 7.
Fig. 7.
Electrical properties of the plasma membrane of hyphae from G. zeae strains PH-1, Δ2 (mid1), and T14 (cch1). (A) Examples of electrical measurements for the three strains. After impalement, the potential stabilized within about 1 min. Then, three current-voltage measurements were performed (vertical bars), followed by the addition of cyanide to deplete cellular ATP and inhibit the H+-ATPase (horizontal bars [as marked]). After the depolarized potential neared the steady state, three more current-voltage measurements were commenced, followed by removal of the micropipette from the cell. (B) Compiled measurements of initial Em (circles), cyanide-induced depolarization (squares), and the difference (Em after cyanide treatment minus Em before cyanide treatment [a measure of H+-ATPase activity]) (triangles). None of the measured values were significantly different among the three strains. (C) Current-voltage relations for the three strains. The values represent the means (n = 12) of the average current-voltage measurements (n = 3) before (circles) and after (squares) cyanide treatment. These data have been normalized to the significantly different hyphal diameters of the three strains by dividing by the hyphal diameter (squared). The units (nanoamperes per micrometer) should not be interpreted as representing current density, which would require experimental measurements of the length constant of the hyphae (30).

References

    1. Alberghina A., Benni A. 1980. Different sensitivity to mitochondrial inhibitors of respiration in Fusarium oxysporum and Fusarium solani. Phytopathol. Z. 99:138–145
    1. Basile L. J., Willson R. C., Sewell B. T., Benedik M. J. 2008. Genome mining of cyanide-degrading nitrilases from filamentous fungi. Appl. Microbiol. Biotechnol. 80:427–435 - PubMed
    1. Berridge M. J., Bootman M. D., Roderick H. L. 2003. Calcium signalling: dynamics, homeostasis and remodelling. Nat. Rev. Mol. Cell Biol. 4:517–529 - PubMed
    1. Bistis G. N. 1981. Chemotropic interactions between trichogynes and conidia of opposite mating-type in Neurospora crassa. Mycologia 73:959–975
    1. Bonila M., Nastase K. K., Cunningham K. W. 2002. Essential role of calcineurin in response to endoplasmic reticulum stress. The EMBO J. 21:2343–2353 - PMC - PubMed

Publication types

LinkOut - more resources