. 2011 Mar;30(3):333-45.
doi: 10.7863/jum.2011.30.3.333.

Contrast-enhanced sonography depicts spontaneous ovarian cancer at early stages in a preclinical animal model

Affiliations

Contrast-enhanced sonography depicts spontaneous ovarian cancer at early stages in a preclinical animal model

Animesh Barua et al. J Ultrasound Med. 2011 Mar.

Abstract

Objective: Our goal was to examine the feasibility of using laying hens, a preclinical model of human spontaneous ovarian cancer, in determining the kinetics of an ultrasound contrast agent indicative of ovarian tumor-associated neoangiogenesis in early-stage ovarian cancer.

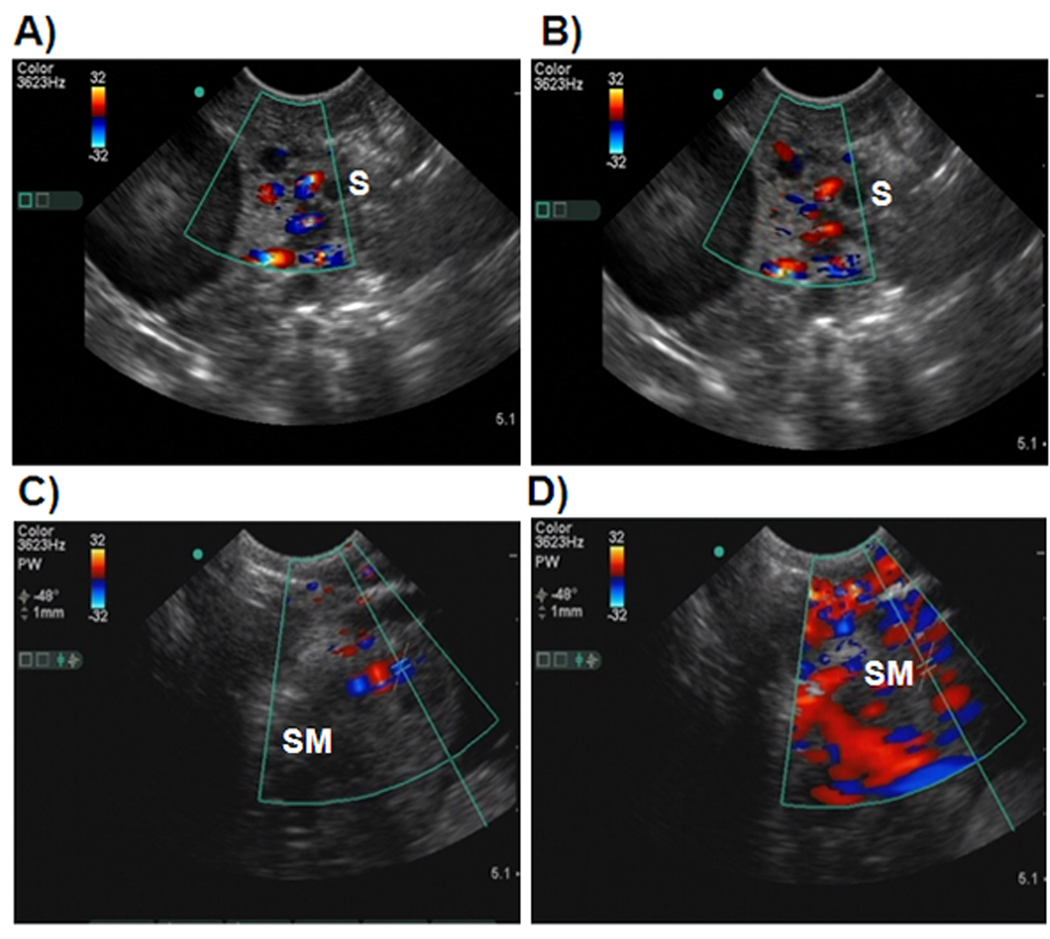
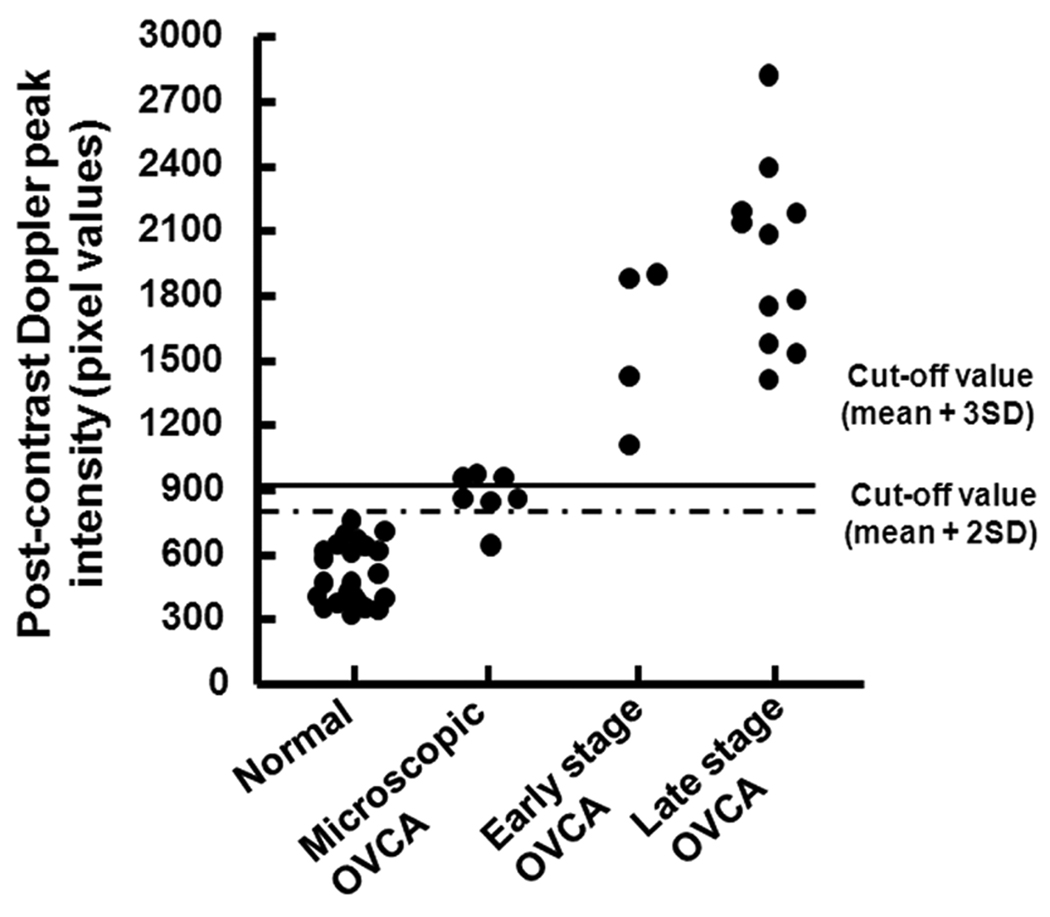
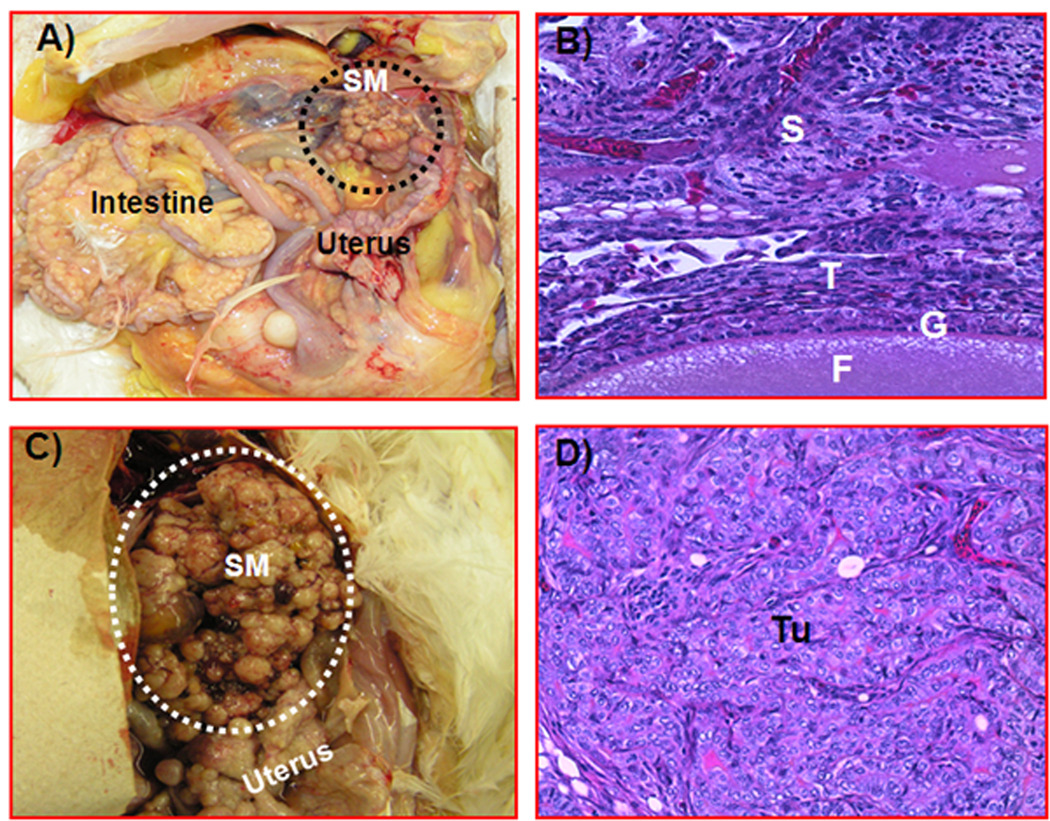
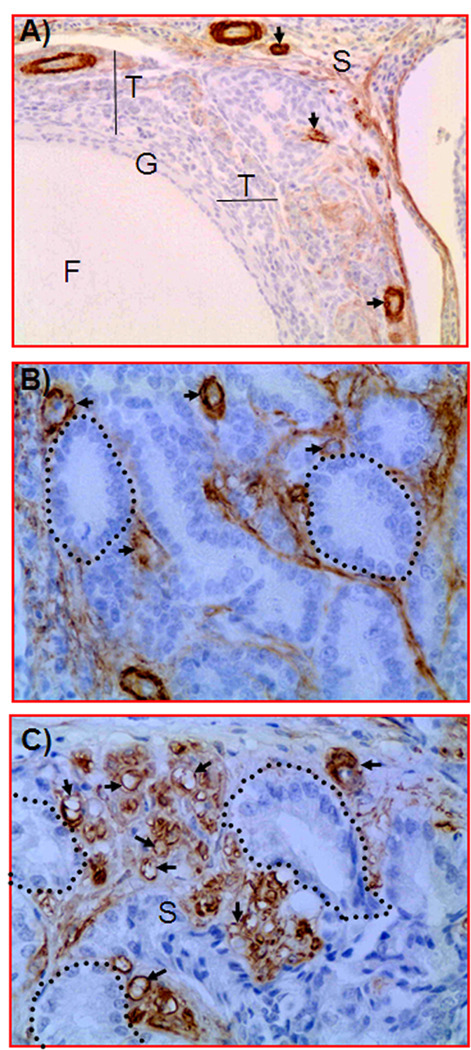
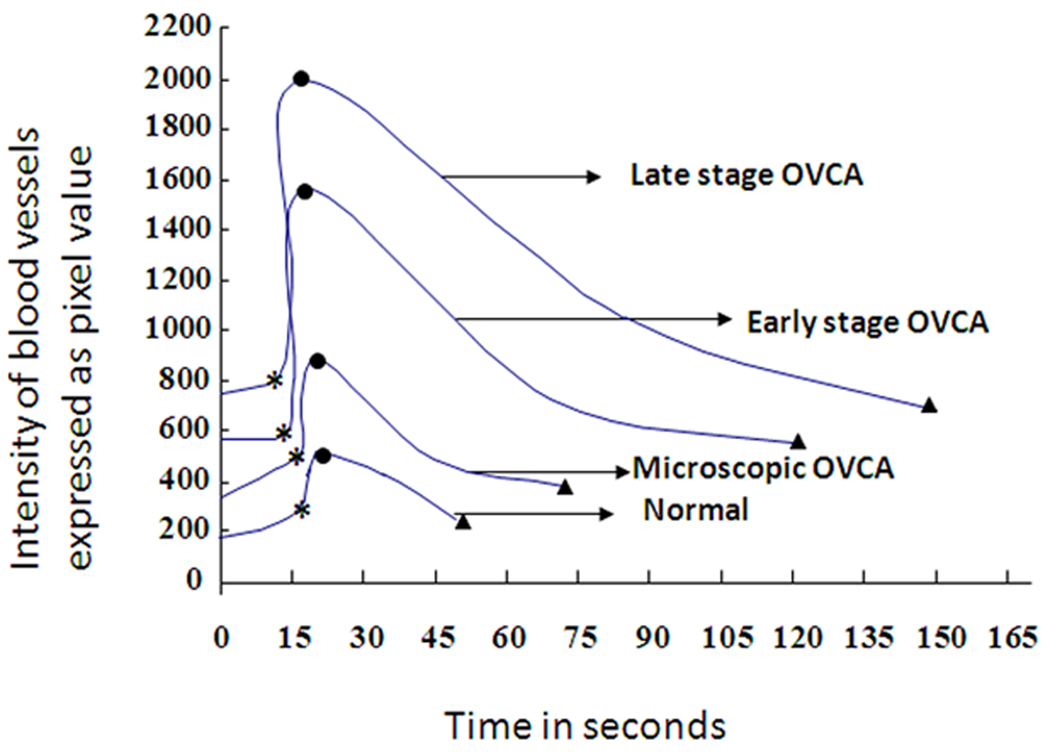
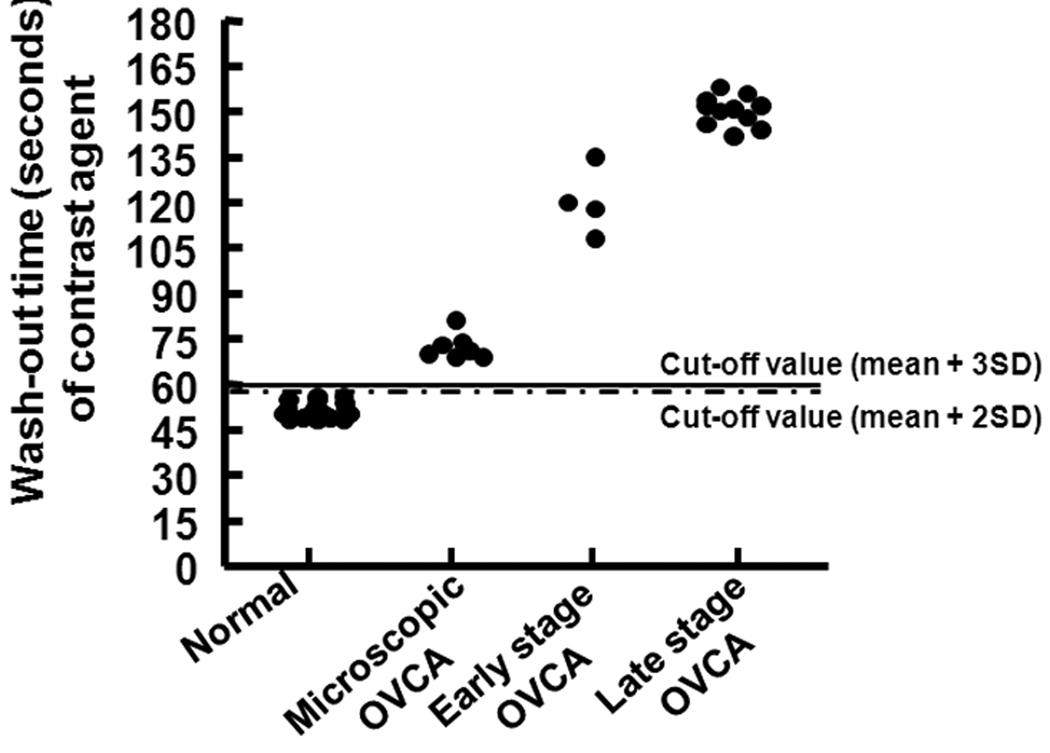
Methods: Three-year-old White Leghorn laying hens with decreased ovarian function were scanned before and after intravenous injection of a human serum albumin-perflutren contrast agent at a dose of 5 μL/kg body weight. Gray scale morphologic characteristics, Doppler indices, the arrival time, peak intensity, and wash-out of the contrast agent were recorded and archived on still images and video clips. Hens were euthanized thereafter; sonographic predictions were compared at gross examination; and ovarian tissues were collected. Archived clips were analyzed to determine contrast parameters and Doppler intensities of vessels. A time-intensity curve per hen was drawn, and the area under the curve was derived. Tumor types and the density of ovarian microvessels were determined by histologic examination and immunohistochemistry and compared to sonographic predictions.

Results: The contrast agent significantly (P < .05) enhanced the visualization of microvessels, which was confirmed by immunohistochemistry. Contrast parameters, including the time of wash-out and area under the curve, were significantly different (P < .05) between ovaries of normal hens and hens with ovarian cancer and correctly detected cancer at earlier stages than the time of peak intensity.

Conclusions: The laying hen may be a useful animal model for determining ovarian tumor-associated vascular kinetics diagnostic of early-stage ovarian cancer using a contrast agent. This model may also be useful for testing the efficacy of different contrast agents in a preclinical setting.


Figures

Figure 1
Figure 1
Precontrast and postcontrast Doppler sonograms of hen ovaries with and without tumors. Scanning of hens was performed in a continuous manner before and after injection of Optison. Images including still and movie clips were digitally archived. Contrast kinetics, namely, the time of arrival, time to reach peak intensity, and time of wash-out, as well as precontrast and postcontrast Doppler indices (resistive and pulsatility index values) were recorded. A, Precontrast sonogram of a normal-appearing ovary showing a preovulatory follicle and few small follicles without any solid mass. B, Corresponding postcontrast sonogram from the same hen. Compared to the precontrast image, more vessels are shown in the postcontrast sonogram. C, Precontrast sonogram from a hen predicted to have an ovarian tumor. A solid tumorlike mass is shown in the ovary, and a central blood flow pattern with a few vessels is shown in and around the mass. D, Postcontrast sonogram of the ovary shown in C. The contrast agent remarkably enhances the intensity of blood vessels as well as visualization of more blood vessels. Compared to the precontrast image, many blood vessels are shown in the postcontrast scan. Sonographic predictions were confirmed at gross (euthanasia) and histopathologic examination. S indicates stroma of the ovary; and SM, solid tissue mass in the ovary.
Figure 2
Figure 2
The contrast agent (Optison) enhanced the ability of Doppler sonography to depict microscopic ovarian tumor-associated vasculature in laying hens. A, Precontrast sonogram of an ovary without a detectable solid ovarian mass or abnormality. Only a few blood vessels are shown in this ovary, with no preovulatory follicle. B, Corresponding sonogram of the same ovary showing the arrival of Optison. Compared to the precontrast image, the number of detectable blood vessels is increased, and the vessels appear more dilated in the postcontrast sonogram. C, Postcontrast sonogram of the same ovary showing the peak level of enhancement. Compared to the precontrast image and postcontrast image at the arrival of Optison, more vessels are shown at peak enhancement. Although no solid ovarian mass is shown, the central vascular arrangement pattern indicates a potential ovarian abnormality. D, Gross appearance of the same ovary at euthanasia. As predicted, neither a large preovulatory follicle nor a detectable solid mass is shown. However, subsequent histopathologic examination showed the presence of an endometrioid lesion (termed a microscopic ovarian tumor), confirming the contrast-enhanced sonographic prediction. Scanning of hens and their subsequent processing were similar to those mentioned in Figure 1. Dotted circle indicates the ovary; and S, stroma.
Figure 3
Figure 3
Detection of ovarian tumor-associated neoangiogenesis by the postcontrast Doppler intensity of blood vessels. A flock of 150 hens were monitored for their ovarian function, and their egg-laying rates were recorded on a daily basis. Hens with low-egg laying rates (n = 46) were selected for sonography. On the basis of gray scale sonography and gross and histopathologic examinations, hens were grouped as having normal ovaries (n = 24 hens), microscopic ovarian cancer (OVCA; n = 7), early-stage ovarian cancer (n = 4), and late-stage ovarian cancer (n = 11). Postcontrast Doppler intensities of ovaries and ovarian tumors were measured by power Doppler sonography after Optison injection. Cutoff lines (mean peak Doppler intensity values of normal hens with 2 or 3 SDs) indicate the detectability of ovarian cancer by postcontrast peak Doppler intensities.
Figure 4
Figure 4
Gross and histologic sections of ovarian tumors in hens scanned with contrast-enhanced sonography. After contrast-enhanced Doppler sonography, hens were euthanized and examined grossly for the presence of a tumor-related solid ovarian mass, which was confirmed by routine histologic examination with hematoxylin-eosin. A, Ovary of a hen with early-stage cancer. Few small solid tumor masses with no preovulatory follicles are present. The tumor is limited to a part of the ovary. B, Section taken from a normal and uninvolved portion of an ovary in which a tumor was detected in the other part of the ovary (early-stage ovarian cancer). Stromal follicles are embedded in the normal-appearing stroma. No invasion of tumor cells is shown in this portion of the ovary. C, Ovarian tumor in a hen with late-stage ovarian cancer. The solid mass appears like a cauliflower. The tumor metastasized to distant organs and was associated with extensive ascites. D, Section of a serous ovarian tumor from a hen with late-stage ovarian cancer. The tumor has a compact sheath of tumor cells with pleomorphic nuclei, and tumor glands are surrounded by fibromuscular layers (hematoxylin-eosin; all sections: original magnification ×20). F indicates follicle; G, granulosa layer of the follicle; S, ovarian stroma; SM, solid tumor mass; T, theca layer of the follicle; and Tu, tumor.
Figure 5
Figure 5
Immunohistochemical detection of ovarian microvessels in laying hens with and without ovarian cancer. Paraffin sections were immunostained with monoclonal anti-smooth muscle actin. A, Section of a hen’s normal ovary. Immunopositive microvessels are shown in the follicular theca and few in the adjacent stroma. Most of the immunopositive vessels have a thick wall. B, Section of a hen’s ovary with early-stage ovarian cancer (ovary shown in Figure 4A). Compared to the normal ovary, more immature immunopositive microvessels with leaky, thinner, incomplete, or discontinuous vessel walls are present between tumor glands. The fibrous connective tissues of the tumor glands are also stained positive. C, Section of an ovarian tumor from a hen with late-stage ovarian cancer (ovary shown in Figure 4C). Compared to the normal ovary and early-stage ovarian cancer, many leaky and immature microvessels with discontinuous or attenuated staining are seen in the vicinity of the tumor. Arrows indicate examples of immunopositive microvessels; dotted circles, examples of tumor glands; F, follicle; G, granulosa layer; S, stroma; and T, theca layer.
Figure 6
Figure 6
Detection of ovarian tumor-associated neoangiogenesis by the wash-out time of the contrast agent. Other information is similar to the Figure 3. Cutoff lines (mean of wash-out time [seconds] of normal hens with 2 or 3 SDs) indicate the detectability of ovarian cancer (OVCA) by the wash-out time of the contrast agent.

Similar articles

Cited by

References

    1. Folkman J. What is the evidence that tumors are angiogenesis dependent? J Natl Cancer Inst. 1990;82:4–6. - PubMed
    1. Shubik P. Vascularization of tumors: a review. J Cancer Res Clin Oncol. 1982;103:211–226. - PubMed
    1. Ramakrishnan S, Subramanian IV, Yokoyama Y, Geller M. Angiogenesis in normal and neoplastic ovaries. Angiogenesis. 2005;8:169–182. - PubMed
    1. Barua A, Bitterman P, Bahr JM, et al. Detection of tumor-associated neoangiogenesis by Doppler ultrasonography during early-stage ovarian cancer in laying hens: a preclinical model of human spontaneous ovarian cancer. J Ultrasound Med. 2010;29:173–182. - PMC - PubMed
    1. Jemal A, Siegel R, Ward E, Hao Y, Xu J, Thun MJ. Cancer statistics, 2009. CA Cancer J Clin. 2009;59:225–249. - PubMed

Publication types