. 2011 Mar 15;25(6):556-68.
doi: 10.1101/gad.618611. Epub 2011 Feb 28.

Autoregulation of convergent RNAi genes in fission yeast

Affiliations

Autoregulation of convergent RNAi genes in fission yeast

Monika Gullerova et al. Genes Dev. .

Abstract

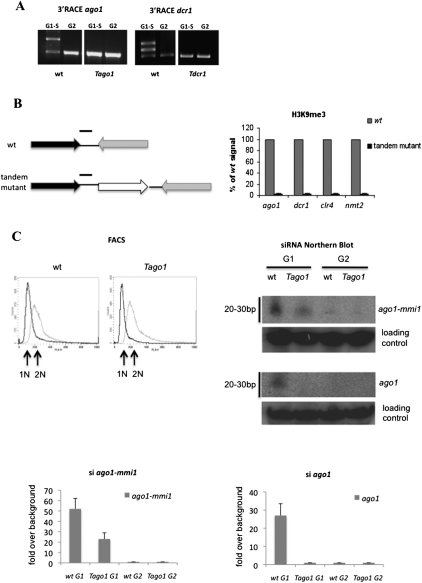
RNAi plays a central role in the regulation of eukaryotic genes. In Schizosaccharomyces pombe fission yeast, RNAi involves the formation of siRNA from dsRNA that acts to establish and maintain heterochromatin over centromeres, telomeres, and mating loci. We showed previously that transient heterochromatin also forms over S. pombe convergent genes (CGs). Remarkably, most RNAi genes are themselves convergent. We demonstrate here that transient heterochromatin formed by the RNAi pathway over RNAi CGs leads to their autoregulation in G1-S. Furthermore, the switching of RNAi gene orientation from convergent to tandem causes loss of their G1-S down-regulation. Surprisingly, yeast mutants with tandemized dcr1, ago1, or clr4 genes display aberrant centromeric heterochromatin, which results in abnormal cell morphology. Our results emphasize the significance of gene orientation for correct RNAi gene expression, and suggest a role for cell cycle-dependent formation of RNAi CG heterochromatin in cellular integrity.


Figures

Figure 1.
Figure 1.
RNAi genes are convergent and down-regulated during G1–S. (A) All RNAi complexes derive from at least two CGs. RNAi CGs are in bold. (B) qRT–PCR analysis shows transcript levels of RNAi CGs in G1–S. Cells were blocked in G1–S by HU (Supplemental Fig. 3A) and compared with cycling (predominantly G2) cells. Eight randomly selected TGs were used as controls. (C) Western blot analysis of RNAi proteins in G1–S and G2. Total protein extracts were isolated from strains expressing RNAi genes with endogenous epitope tags (TAP or Flag). Equal amounts of proteins were loaded on the membrane and detected with either horseradish peroxidase-conjugated anti-peroxidase specific for TAP or horseradish peroxidase-conjugated anti-Flag M2. pfs2-GFP and swi6-GFP TGs were used as controls, detecting their protein expression using anti-GFP. These showed no significant difference between G1–S and G2. Equal amounts of proteins loaded were confirmed by Western blotting using anti-tubulin antibody. Quantitation was based on three independent experiments. (D) Pol II preferentially localizes to centromeres (cen) in G1–S and to CGs in G2. ChIP signals were normalized to 100%. Relative ratios between G1–S and G2 signals are shown graphically. Centromeric PCR primers detect the dg repeat sequence.
Figure 2.
Figure 2.
Comparison of heterochromatin (H3K9me3) between cen and CGs. CG heterochromatin was isolated from HU-blocked cells (Supplemental Fig. 3A), while cen was from unsynchronized cells. ChIP analysis was performed using H3K9me3 antibody. Probe for cen is specific to dg repeat. Probes for CGs represent average signal of four different CG probes in ORFs (mei4, act1, nmt2, and avn2). ChIP signals were normalized to wild-type levels (100%). Bars represent at least three biological repeats. Errors were determined by SD. (A–D) H3K9me3 ChIP analysis is shown on cen and CGs in Δdcr1, Δago1, and Δchp1 (A), in RDRC deletion mutants (B), in CLRC deletion mutants (C), and for sir2 and clr3 HDAC deletion mutants (D). (E) Plasmid expressing dcr1 D937A (RNase III catalytic domain mutant) was transformed into a Δdcr1 background and compared with wild-type cells by ChIP analysis, as above. (F) Plasmid expressing ago1 D580A (slicer mutant) was transformed into Δago1 and compared with wild-type cells by ChIP analysis, as above.
Figure 3.
Figure 3.
Autoregulation of RNAi genes. (A) Steady-state RNA analysis of RNAi genes in RNAi mutants. Total RNA was extracted from RNAi mutant strains, grown in minimal medium, blocked in G1–S, and measured by qRT–PCR using oligo dT. (B) Steady-state RNA analysis of RNAi genes in RDRC mutants, as in A. (C) Ago1 preferentially localizes to cen in G2 and to CGs in G1–S, but not to TGs (Supplemental Fig. 2C). ChIP analysis used anti-Flag in ago1-Flag-tagged strain blocked in G1–S or G2. Probes in the cen dg region and several RNAi CGs were analyzed.
Figure 4.
Figure 4.
Gene orientation dictates RNAi CG expression during the cell cycle. (A–D) ura4 was introduced between the four CGs by homologous recombination as indicated, changing the orientation of adjacent RNAi CGs to tandem and itself becoming a CG. Total RNA was isolated from wild type and tandem mutants and blocked in G1–S by HU or released into G2, and RNA levels were determined by RT–PCR. Quantification shown below bands is expressed in arbitrary units. Multiple repeats of these experiments gave similar values within a 5% range. Specific RT primers were positioned within ORFs. Tandem fbp1 was used as a control. (A,B, right graphs) Tago1 and Tdcr1 were further quantitated by real-time RT–PCR. Also shown in A is a Western blot analysis of Ago1 in wild-type or Tago1 cells blocked in G1–S by HU or released to G2. Anti-Ago1 antibody was used to detect Ago1 protein levels. Equal levels of total protein extracts were confirmed by Western blotting using anti-tubulin antibody.
Figure 5.
Figure 5.
Tandemized CGs lose G1–S-specific RNAi-mediated heterochromatin. (A) 3′RACE analysis of ago1 and dcr1 using RNA isolated from wild-type, Tago1, or Tdcr1 cells blocked in G1–S by HU or released to G2. Phased oligo dT was used for reverse transcription. DNA was amplified by PCR using phased dT and specific forward primer within ago1 or dcr1 ORFs. (B) ChIP analysis using H3K9me3 antibody over intergenic region in wild-type or tandemized RNAi genes, as indicated in the left gene maps. Black bar denotes position of PCR primer amplicon. Graphs on the right show qPCR ChIP signals as indicated. (C) Northern blot analysis of ago1-mmi1 CG siRNAs from G1 and G2 cells. (Left) FACs analysis of G1-selected cells using nitrogen starvation (dark trace) or unsynchronized predominantly G2 cells (light trace). G1 cells are predominantly haploid, while other cells were diploid. (Right) Northern blot of ago1-mmi1 siRNAs or ago1 alone siRNAs isolated from G1 or G2 enriched cells. Loading control is tRNA detected by nonspecific hybridization to oligonucleotide probes and indicates near-equal loading of small RNA samples to each lane. Quantification is presented below the Northern blot analysis, showing the average values obtained from three independent experiments.
Figure 6.
Figure 6.
Altered ago1 and dcr1 expression inhibits centromeric transcription and causes aberrant gene silencing. (A) RT–PCR analysis of RNA isolated from wild-type, Tago1, Tdcr1, Tclr4, and Tnmt2 strains. RT primers within dg and ORFs of ago1-, dcr1-, clr4-, and fbp1-generated cDNAs were amplified by PCR. (B) Pol II ChIP signals are reduced at cen in chromatin isolated from Tago1, Tdcr1, and Tclr4 cells. Tnmt2 does not affect Pol II occupancy at cen. Tandem fbp1 gene was used as control, showing similar Pol II levels in all tested strains. (C) RT–PCR analysis showing effect of RNAi gene dosage (either overexpression or gene deletion) on cen and CG transcription. RT–PCR products were analyzed on agarose gel and quantified using Mass Quant software. Signals were compared with wild-type signal (set as 100%). Error bars are based on three biological repeats. (D) Pol II reduction at cen in cells overexpressing ago1 or dcr1. TG fbp1 was used as a control. Pol II ChIP signals were compared with wild-type signal, which was set as 100%. (E) Northern blot analysis of cen siRNAs from G1–S or G2 wild-type or Tago1 cells as in Figure 5C. (F) Silencing assay using ade6 marker integrated at cnt1, as depicted. Reporter strain is denoted as wild type. Δago1, +ago1, and Tago1 have the same reporter background. Cells were grown on EMM-low ade plates. Pink corresponds to silenced ade6 marker. White in Δago1 cells reflects impaired silencing at centromeres. Overexpression of ago1 causes dark-red colonies. Tandem ago1 shows an intermediate red.
Figure 7.
Figure 7.
Strains harboring tandem-oriented RNAi genes show defective cellular phenotypes. (A) Wild-type, Tago1, Tdcr1, Tclr4, and Tnmt2 cells were observed by light microscopy. Exponential cultures were grown in EMM medium. (B) Analysis of DAPI-stained mitotic nuclei in wild-type, Tago1, Tdcr1, Tclr4, and Tnmt2 cells reveals archery bow phenotype in Tago1, Tdcr1, and Tclr4 cells. Values below selected cells show percentage of cells with the shown phenotype, based on indicated sample numbers. Wild type and Tnmt2 show the expected wild-type pattern, while Tago1, Tdcr1, and Tclr4 show the mutant phenotype. (C) +ago1 and +dcr1 have aberrant morphology compared with wild type. Cells were grown in EMM medium and analyzed by light microscopy using a 100× objective. (D) Model of cell cycle-dependent RNAi regulation of heterochromatin. Transcription of cen repeats is detectable in G1–S, when CGs are silenced by RNAi-dependent formation of transient heterochromatin. CGs are highly transcribed in G2, when cen is silenced. RNAi apparatus is denoted as ovals, while elongating Pol II is indicated in cartoon format. Red arrows denote silenced RNAi CGs in G1–S, while green arrows denote active RNAi CGs in G2.

Comment in

  • RNAi genes pave their own way.
    Kamminga LM, Ketting RF. Kamminga LM, et al. Genes Dev. 2011 Mar 15;25(6):529-33. doi: 10.1101/gad.2038611. Genes Dev. 2011. PMID: 21406552 Free PMC article.

References

    1. Adams BD, Claffey KP, White BA 2009. Argonaute-2 expression is regulated by epidermal growth factor receptor and mitogen-activated protein kinase signaling and correlates with a transformed phenotype in breast cancer cells. Endocrinology 150: 14–23 - PMC - PubMed
    1. Allshire RC, Javerzat JP, Redhead NJ, Cranston G 1994. Position effect variegation at fission yeast centromeres. Cell 76: 157–169 - PubMed
    1. Aranda A, Proudfoot NJ 1999. Definition of transcriptional pause elements in fission yeast. Mol Cell Biol 19: 1251–1261 - PMC - PubMed
    1. Birse CE, Lee BA, Hansen K, Proudfoot NJ 1997. Transcriptional termination signals for RNA polymerase II in fission yeast. EMBO J 16: 3633–3643 - PMC - PubMed
    1. Buhler M, Spies N, Bartel DP, Moazed D 2008. TRAMP-mediated RNA surveillance prevents spurious entry of RNAs into the Schizosaccharomyces pombe siRNA pathway. Nat Struct Mol Biol 15: 1015–1023 - PMC - PubMed

Publication types

Substances

LinkOut - more resources