. 2011 Jun;96(6):820-8.
doi: 10.3324/haematol.2010.031179. Epub 2011 Feb 28.

Up-regulation of homeodomain genes, DLX1 and DLX2, by FLT3 signaling

Affiliations

Up-regulation of homeodomain genes, DLX1 and DLX2, by FLT3 signaling

Julia Starkova et al. Haematologica. 2011 Jun.

Abstract

Background: Activating mutations in fms-like tyrosine kinase-3 (FLT3) are frequent in acute myeloid leukemia and represent both a poor prognostic feature and a therapeutic target. We have identified a previously unrecognized downstream effect of FLT3 activation, namely up-regulation of the homeodomain genes, DLX1 and DLX2.

Design and methods: MV4;11 cells with FLT3-internal tandem duplication mutation, RS4;11 cells with wild-type FLT3 and blasts from patients with acute myeloid leukemia were used to pursue the relation between FLT3, DLX1/2 and transforming growth factor-β (TGFβ). Real-time quantitative reverse transcriptase polymerase chain reaction, western blot and reverse-phase protein array were performed to detect changes in gene and protein expression. RNA interference and MTS assays were used to study the interaction of PKC412, FLT3 inhibitor and TGFβ1.

Results: A direct relationship between FLT3 activity and DLX1/2 expression was revealed by both inhibition and up-regulation of FLT3 signaling in MV4;11 and RS4;11 cell lines, respectively, in isolated blast cells from patients with acute myeloid leukemia, and in reverse-phase protein array assays of samples from patients with acute myeloid leukemia. Mechanistically, the link between FLT3 and DLX1 expression appears to involve MAPK signaling through the ERK and JNK pathways. To determine whether elevated DLX1 had a functional consequence, we explored the reported inhibition by DLX1 on TGFβ/Smad signaling. Indeed, TGFβ responses were blunted by FLT3 activation in a DLX1-dependent manner and FLT3 inhibition resulted in a time-dependent increase in nuclear phospho-Smad2.

Conclusions: These findings suggest that alterations in DLX1/2 contribute to the biological consequences of FLT3 activation.


Figures

Figure 1.
Figure 1.
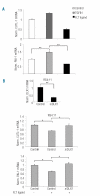
Effect of PKC412 on DLX1 and DLX2 gene expression (A). The Y axis shows the fold-change of gene expression of DLX1 and DLX2 in samples treated for 0, 2, 5 and 24 h with kinase inhibitors. Western blot shows effectiveness of PKC412 on p-FLT3 inhibition and DLX1 protein expression in the MV4;11 cell line. (B) Fold-change of DLX1 and DLX2 expression in RS4;11 cells treated for 2, 5 and 24 h with FLT ligand (100 ng/mL) DLX1 and DLX2 mRNA levels were detected. The western blot shows DLX1 protein expression in the RS4;11 cell line. (C) Normalized DLX1 expression in RS4;11 (5 h) and (D) MV4;11 (5 h) cell lines after treatment with ERK1/2 (U0126, 10 μM), JNK1/2 (SP600125, 10 μM), PI3K (LY294002, 10 μM) and p38 (SB203580, 10 μM) inhibitors in FLT3 activated pathway. Asterisks correspond to statistically significant change, ***P<0.0001.
Figure 2.
Figure 2.
DLX1 expression in samples from AML patients and effect of PKC42 ex vivo (A) Box plots showing results of RPPA analysis in AML patients characterized according to FLT3 status (NEG – FLT3wt; POS – FLT3/ITD) using the ANOVA test (B) Box plot illustrating the results of the Mann-Whitney statistical test for DLXI expression in diagnostic samples from AML patients with (FLT3/ITDpos) or without FLT3/ITD (FLT3/ITDneg) (C) Relative expression of DLX1 presented as fold-change in leukemic blasts isolated from bone marrow cells of AML patients with FLT3 wild-type or FLT3/ITD mutation treated with PKC412. The expression of DLX2, CUTL-1, p15 and Id2 was also studied in leukemic blasts isolated from the bone marrow of AML patients with FLT3/ITD and treated with PKC412 for 24 h. Asterisks correspond to statistically significant changes, *P≤0.02, **P≤0.001.
Figure 3.
Figure 3.
Expression of p15, CUTL-1 and PAI-1 genes (A) Graphs show fold-change of p15, CUTL-1 and PAI-1 gene expression in MV4;11 cells after PKC412 (0.1 μM) and TGFβ1 (1, 2, 3, 5 ng/mL) treatment, alone or in combination, normalized to untreated control cells and the effect of siDLX1 in the presence of TGFβ1 (5 ng/ mL). All measurements were performed 24 h after treatment in triplicate. (B) Downregulation of DLX1 in MV4;11 cells using siRNA after 24 h. Asterisks correspond to statistically significant changes, **P≤0.0008.
Figure 4.
Figure 4.
Knockdown of DLX1 (siDLX1) alters response to TGFβ1 and FLT3 ligand. (A) Relative expression of CUTL-1 and PAI-1 in RS4;11 cells treated with TGFβ1 (5 ng/mL) or FLT ligand (100 ng/mL) for 24 h compared to untreated control cells; (B) Down-regulation of DLX1 in RS4;11 cells using siRNA after 24 h blocks FLT3 ligand-mediated suppression of CUTL-1 and PAI-1. Cells were transfected with either non-targeted siRNA (control) or siDLX1 and exposed to FLT3 (100 ng/mL for 24 h). Asterisks correspond to statistically significant changes, *P<0.05; **P≤0.0004.
Figure 5.
Figure 5.
Cytostatic effect of PKC412, TGFβ1 and their combination. Results of MTS assay using threshold concentrations of TGFβ1 (T) and PKC412 (P) and their combination (T+P) were monitored 72 h after incubation. Experiments were done in triplicate and the standard deviation was calculated. Asterisks correspond to statistically significant changes, *P≤0.03; **P≤0.005; ***P<0.0001.
Figure 6.
Figure 6.
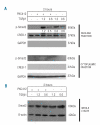
Effect of PKC412 on phosphorylation of Smad2. (A) Phospho-Smad2 detected by western blot in MV4;11 cells treated with PKC412 (0.1 μM) and TGFβ1 (0.6 and 1.2 ng/mL) alone, or in combination, in nuclear and cytoplasmic fractions at 2 h. CREB-1 (nuclear protein) and GAPDH (cytoplasmic protein) were used as controls. Values from densitometry are shown. (B) Total Smad2 was detected in whole lysates. All experiments were done in independent triplicates. Representative examples are shown.

References

    1. Apiou F, Flagiello D, Cillo C, Malfoy B, Poupon MF, Dutrillaux B. Fine mapping of human HOX gene clusters. Cytogenet Cell Genet. 1996;73(1–2):114–5. - PubMed
    1. Fujino T, Suzuki A, Ito Y, Ohyashiki K, Hatano Y, Miura I, et al. Single-translocation and double-chimeric transcripts: detection of NUP98-HOXA9 in myeloid leukemias with HOXA11 or HOXA13 breaks of the chromosomal translocation t(7;11)(p15;p15) Blood. 2002;99(4):1428–33. - PubMed
    1. Lahortiga I, Belloni E, Vazquez I, Agirre X, Larrayoz MJ, Vizmanos JL, et al. NUP98 is fused to HOXA9 in a variant complex t(7;11;13;17) in a patient with AML-M2. Cancer Genet Cytogenet. 2005;157 (2):151–6. - PubMed
    1. Nakamura T. NUP98 fusion in human leukemia: dysregulation of the nuclear pore and homeodomain proteins. Int J Hematol. 2005;82(1):21–7. - PubMed
    1. Nishiyama M, Arai Y, Tsunematsu Y, Kobayashi H, Asami K, Yabe M, et al. 11p15 translocations involving the NUP98 gene in childhood therapy-related acute myeloid leukemia/myelodysplastic syndrome. Genes Chromosomes Cancer. 1999;26(3):215–20. - PubMed

Publication types

MeSH terms