. 2011 Mar 7;192(5):735-50.
doi: 10.1083/jcb.201011025. Epub 2011 Feb 28.

ATP-dependent and independent functions of Rad54 in genome maintenance

Affiliations

ATP-dependent and independent functions of Rad54 in genome maintenance

Sheba Agarwal et al. J Cell Biol. .

Abstract

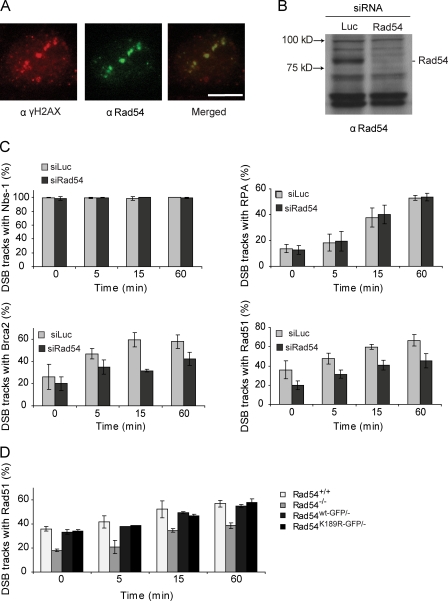
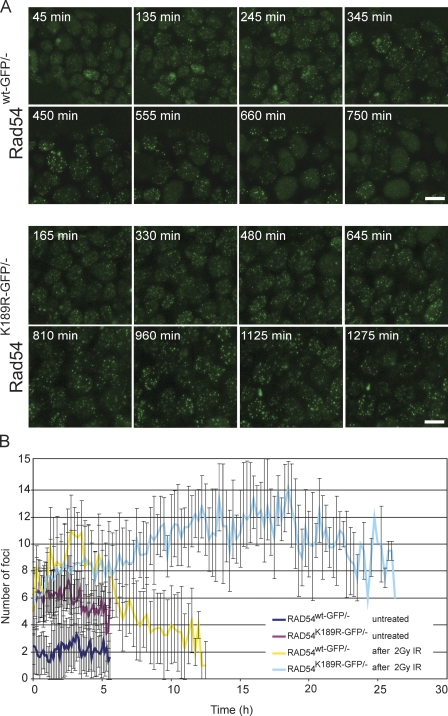
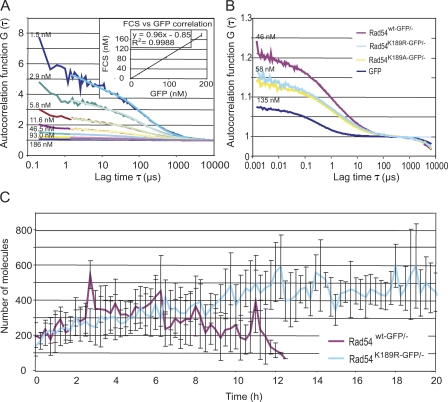
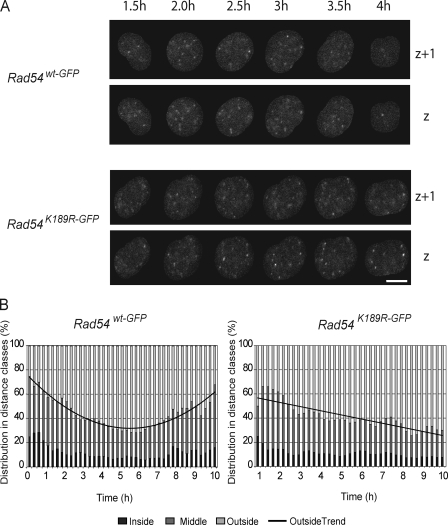
Rad54, a member of the SWI/SNF protein family of DNA-dependent ATPases, repairs DNA double-strand breaks (DSBs) through homologous recombination. Here we demonstrate that Rad54 is required for the timely accumulation of the homologous recombination proteins Rad51 and Brca2 at DSBs. Because replication protein A and Nbs1 accumulation is not affected by Rad54 depletion, Rad54 is downstream of DSB resection. Rad54-mediated Rad51 accumulation does not require Rad54's ATPase activity. Thus, our experiments demonstrate that SWI/SNF proteins may have functions independent of their ATPase activity. However, quantitative real-time analysis of Rad54 focus formation indicates that Rad54's ATPase activity is required for the disassociation of Rad54 from DNA and Rad54 turnover at DSBs. Although the non-DNA-bound fraction of Rad54 reversibly interacts with a focus, independent of its ATPase status, the DNA-bound fraction is immobilized in the absence of ATP hydrolysis by Rad54. Finally, we show that ATP hydrolysis by Rad54 is required for the redistribution of DSB repair sites within the nucleus.


Figures

Figure 1.
Figure 1.
Characterization of mouse ES cells carrying ATPase-defective Rad54–GFP alleles. (A) Schematic representation of the mouse Rad54 locus and the gene-targeting constructs. The top line represents a 30-kb portion of endogenous Rad54 locus, where black boxes indicate exons I–XVIII. The middle line shows the linearized targeting construct, containing the human RAD54 cDNA sequence spanning exons IV–XVIII fused to the GFP coding sequence. The K189R and K189A mutations in the Walker A ATPase domain are indicated by the asterisks. The construct contains a gene encoding for puromycin resistance as a selectable marker. The targeting construct will replace the regions between exons III and VIII when correctly integrated to generate the targeted allele, as shown in the targeted locus. Homologous integration results in the expression of full-length, GFP-tagged Rad54 from its endogenous promoter. (B) DNA blot analysis of ES cells carrying the knockin contructs. DNA blot analysis was performed using genomic DNA purified from puromycin-resistant clones and digested with StuI. Detection of bands was performed using a probe that recognized exons VII/VIII. Restriction of the wild-type allele by StuI, (indicated by “+”), yields a 9.0-kb band after hybridization with an exon VII/VIII probe. Diagnostic bands for the neomycin-resistant knockout alleles, indicated by “−“, are 7.6 kb for a hygromycin-resistant allele and 6.0 kb for a neomycin-resistant allele. Knockin alleles are characterized by a doublet of bands ∼6.5 kb. (C) Immunoblot analysis of proteins produced by the Rad54–GFP knockin and -out alleles. Whole cell extracts of ES cells with the indicated genotypes were probed with affinity purified anti–human Rad54 antibodies. The position of Rad54 and Rad54–GFP are indicated. The arrowhead indicates a nonspecific signal. Probing against Msh6 and actin was used to confirm equal protein loading. (D) Ionizing radiation and mitomycin C survivals. ES cells of the indicated genotypes were tested for their ability to survive treatments with increasing doses of ionizing radiation (γ irradiation) or mitomycin C using clonogenic survival assays. The assays were performed in triplicate and the error bars indicated the standard error of the mean.
Figure 2.
Figure 2.
Effect of Rad54 ATPase activity on focus formation. (A) Shown are confocal images of untreated living ES cells expressing wild-type or ATPase-defective Rad54–GFP. The mean number of spontaneous nuclear foci in cells expressing either version of ATPase-defective Rad54 is considerably greater compared with cells expressing wild-type Rad54. (B) Rad51 immunostaining in untreated ES cells of the indicated genotypes. The top shows confocal images of Rad54 as detected by GFP fluorescence. The middle shows the Rad51 staining pattern as detected by anti-Rad51 antibody staining. The merged images are shown on the bottom. The number of Rad51 foci per cell is indicated (mean ± SD). The difference in number of Rad51 foci per cell between Rad54wt-GFP/− and Rad54−/− ES cells and the difference between Rad54K189R-GFP/− and Rad54K189A-GFP/− ES cells is not significant, whereas the difference between these two groups is (P < 0.0001), as determined by the one-way analysis of variance (ANOVA) and a Student’s t test. Bars, 10 µm.
Figure 3.
Figure 3.
Analysis of γH2AX and 53BP1 in Rad54 ATPase-defective ES cells. (A) Whole cell extracts of ES cells with the indicated genotype were either not treated (left) or harvested 1 h after irradiation with 8 Gy (right) and analyzed by immunoblotting using an anti-γH2AX antibody. Antibodies against Ku80 were used to confirm equal loading (bottom). (B) Quantification of the mean number of γH2AX foci in untreated Rad54wt-GFP/− and Rad54K189R-GFP/− ES cells. Error bars indicates standard error of the mean. (C) Immunofluorescence detection of 53BP1 in untreated ES cells. The top shows 53BP1 staining in Rad54wt-GFP/−, Rad54K189R-GFP/−, and Rad54K189A-GFP/− ES cells, the middle shows the GFP staining, and the panel shows the merged images. Bar, 10 µm.
Figure 4.
Figure 4.
Photobleaching analysis of Rad54 in foci. (A) Spot-FRAP analysis of Rad54 in foci. A small square containing an individual Rad54 focus was bleached and monitored for fluorescence recovery for each indicated genotype (n = 35). As a control, the fluorescence recovery of non–foci-associated nuclear Rad54 was quantitated (dark blue line). (B) Visualization of iFRAP analysis of Rad54 in foci. The whole cell was bleached excluding a small circular area containing an individual Rad54 focus (red circle). Fluorescence depletion of the nonbleached focus was monitored and compared with the fluorescence level of an unbleached region without a focus (blue circle) for Rad54wt-GFP and Rad54K189A-GFP. Shown here are four frames: before, during, directly after, and 9 s after bleaching. Bar, 5 µm. (C) Quantification of the iFRAP experiment described in B. Graphs represent the fluorescent depletion over time and are based on five individual cells.
Figure 5.
Figure 5.
The Rad54 protein, but not its ATPase activity, affects Rad51 recruitment to sites of DSBs. Accumulation of DSB repair proteins at α particle–induced DSB tracks. (A) Localization of Rad54 to the α particle–induced double-stranded break colocalizing with DSB marker γH2Ax. Bar, 5 µm. (B) RAD54 protein levels in U2Os cells transfected with indicated siRNAs. Cell lysates were analyzed by immunoblotting with antibodies against RAD54. Equal sample loading was verified by the equal presence of nonspecific bands. (C) Quantification of accumulation of Nbs1, RPA, Rad51, and BRCA2 at α particle–induced tracks of DSBs 0, 5, 15, and 60 min after irradiation in the presence or absence Rad54. U2Os cells were stained for either γH2Ax (Nbs1 and Rad51) or 53BP1 (RPA and Brca2) as a DSB marker and for one of the indicated repair proteins at t = 0, 5, 15, and 60 min after irradiation. t = 0 indicates the first time point after α particle irradiation. Graphs represent mean percentage of positive DSB tracks with a repair protein. 100 cells containing α particle–induced tracks were scored per experiment. Error bars represent the range of percentages obtained from three independent experiments. (D) Quantification of Rad51 accumulation at DSB sites 0, 5, 15, and 60 min after α particle irradiation in Rad54+/+, Rad54−/−, Rad54wt-GFP/−, and Rad54K189R-GFP/− ES cells. Graphs represent mean percentage of Rad51-positive tracks per γH2Ax track. 100 cells containing damage induced by α particles were scored per experiment. Error bars represent the range of percentages obtained from two independent experiments.
Figure 6.
Figure 6.
Quantification of Rad54 foci over time in response to irradiation. (A) Time-lapse imaging of irradiated Rad54wt-GFP/− and Rad54K189R-GFP/− ES cells. Cells were treated with 2 Gy and imaged every 15 min starting 45 min after irradiation. Each picture represents a frame in the resulting movie at the indicated time point. (B) Quantification of the number of foci per cell over time based on the movies represented in A. Quantification was performed using ImageJ as described in the Materials and methods. Error bars indicate SD. Bars, 10 µm.
Figure 7.
Figure 7.
FCS concentration measurement. (A) Autocorrelation function G (τ) measured by FCS of increasing concentrations of GFP. Inset indicates GFP concentration measurement by FCS of purified GFP in solution plotted as FCS concentration (nM) versus GFP concentration (nM). (B) Autocorrelation function G (τ) measured by FCS in Rad54wt-GFP/−, Rad54K189R-GFP/−, and Rad54K189A-GFP/− ES cells. As a control, cells expressing free untagged GFP (GFP) were used. (C) Quantification of the number of Rad54–GFP molecules after treatment of cells with 2 Gy, either wild type or K189R mutant, in a single focus over time. Error bars indicate SD.
Figure 8.
Figure 8.
Nuclear relocalization of Rad54–GFP foci in response to DNA damage. (A) Grayscale representation of the nuclear redistribution of Rad54 foci in a wild-type or ATPase-defective Rad54–GFP cell after treatment with ionizing radiation using a 137Cs source. Shown are a subset of time points in 2 (out of 10) z axes of a single cell. Bar, 5 µm. (B) Quantification of A. The relative distribution of foci in distance classes; inside (0–2 µm), middle (2–4 µm), and outside (> 4 µm) followed over time. Graph indicates the best fitting distribution curve of outside foci in Rad54wt-GFP/− and Rad54K189R-GFP/− cells.

Similar articles

Cited by

References

    1. Agarwal S., Tafel A.A., Kanaar R. 2006. DNA double-strand break repair and chromosome translocations. DNA Repair (Amst.). 5:1075–1081 10.1016/j.dnarep.2006.05.029 - DOI - PubMed
    1. Alexeev A., Mazin A., Kowalczykowski S.C. 2003. Rad54 protein possesses chromatin-remodeling activity stimulated by the Rad51-ssDNA nucleoprotein filament. Nat. Struct. Biol. 10:182–186 10.1038/nsb901 - DOI - PubMed
    1. Alexiadis V., Kadonaga J.T. 2002. Strand pairing by Rad54 and Rad51 is enhanced by chromatin. Genes Dev. 16:2767–2771 10.1101/gad.1032102 - DOI - PMC - PubMed
    1. Amitani I., Baskin R.J., Kowalczykowski S.C. 2006. Visualization of Rad54, a chromatin remodeling protein, translocating on single DNA molecules. Mol. Cell. 23:143–148 10.1016/j.molcel.2006.05.009 - DOI - PubMed
    1. Aten J.A., Stap J., Krawczyk P.M., van Oven C.H., Hoebe R.A., Essers J., Kanaar R. 2004. Dynamics of DNA double-strand breaks revealed by clustering of damaged chromosome domains. Science. 303:92–95 10.1126/science.1088845 - DOI - PubMed

Publication types

MeSH terms