

T1ρ magnetic resonance imaging and discography pressure as novel biomarkers for disc degeneration and low back pain
- PMID: 21358489
- PMCID: PMC4002043
- DOI: 10.1097/BRS.0b013e31820287bf
T1ρ magnetic resonance imaging and discography pressure as novel biomarkers for disc degeneration and low back pain
Abstract
Study design: Prospective magnetic resonance imaging (MRI) study of patients low back pain (LBP) requiring discography as part of their routine clinical diagnoses and asymptomatic age-matched volunteers.
Objective: To determine whether T1ρ MRI and discography opening pressure (OP) are quantitative biomarkers of disc degeneration in LBP patients and in asymptomatic volunteers.
Summary of background data: Disc degenerative disease, a common cause of LBP, is related to the patient's prognosis and serves as a target for therapeutic interventions. However, there are few quantitative measures in the clinical setting. Discography OP and T1ρ MRI are potential biomarkers of disc degenerative disease related to biochemical composition of the intervertebral disc.
Methods: The institutional review board approved all experiments, and informed consent was provided by each subject. Patients being treated for LBP (n = 17; 68 levels; mean age, 44 ± 6 years; and range, 30-53) and control subjects (n = 11; 44 levels; mean age, 43 ± 17 years; and range, 22-76) underwent T1ρ and T2 MRI on a Siemens 3T Tim Trio clinical scanner (Siemens Medical Solutions, Malvern, PA). The LBP patients also received multilevel provocative discography before their MRI. OP was recorded as the pressure when fluid first enters the nucleus of the intervertebral disc.
Results: T1ρ was significantly lower in the painful discs (55.3 ± 3.0 ms, mean ± SE) from control (92.0 ± 4.9 ms, P < 0.001) and nonpainful discs (83.6 ± 3.2 ms, P < 0.001). Mean OP for the painful discs (11.8 ± 1.0 psi, mean ± SE) was significantly lower than that for nonpainful discs (19.1 ± 0.7 psi, P < 0.001). Both T1ρ and OP correlated moderately with Pfirrmann degenerative grade. Receiver-operating-characteristic area under the curve was 0.91 for T1ρ MRI and 0.84 for OP for predicting painful discs.
Conclusion: T1ρ and OP are quantitative measures of degeneration that are consistent across both control subjects and LBP patients. A significant and strong correlation exists between T1ρ values and in vivo OP measurements obtained by discography in LBP patients.
Figures


 , n=25) discs with no pain (
 , n=43) in the LBP cohort and in control discs (△, n=44). Disc OP and Pfirrmann grade (B) are correlated significantly with r=-0.52 (p<0.001) in LBP patients with painful discs (
) discs with no pain (
).
, n=43) in the LBP cohort and in control discs (△, n=44). Disc OP and Pfirrmann grade (B) are correlated significantly with r=-0.52 (p<0.001) in LBP patients with painful discs (
) discs with no pain (
).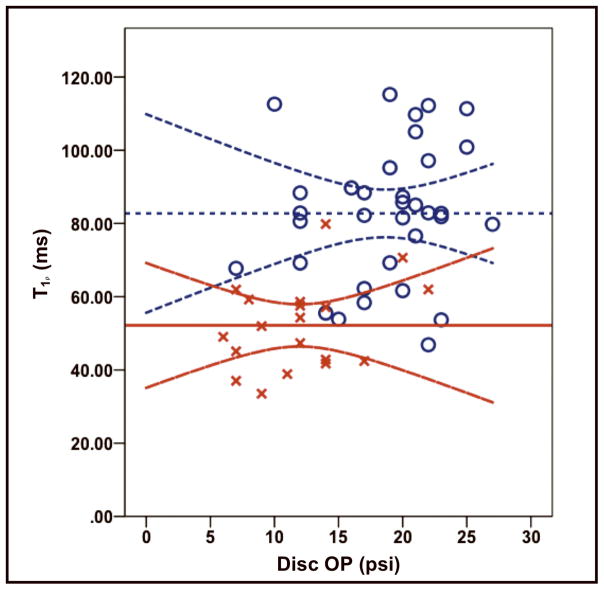 ) exhibiting both lower pressure and T1ρ values compared to discs with no pain (
). The horizontal lines indicate significantly (p<0.001) different mean T1ρ of the painful (55.3 ms, solid line) and non-painful (83.6 ms, dashed line). Also shown are the 95% confidence limits for both means as corresponding curved lines.
) exhibiting both lower pressure and T1ρ values compared to discs with no pain (
). The horizontal lines indicate significantly (p<0.001) different mean T1ρ of the painful (55.3 ms, solid line) and non-painful (83.6 ms, dashed line). Also shown are the 95% confidence limits for both means as corresponding curved lines.
References
-
- Wipf J, Deyo R. Low back pain. Med Clin North Am. 1995;79(2):231–46. - PubMed
-
- Adams M, Roughley P. What is intervertebral disc degeneration, and what causes it? SPINE. 2006:2151–61. - PubMed
-
- Carragee EJ, Hannibal M. Diagnostic evaluation of low back pain. Orthopedic Clinics of North America. 2004;35(1):7–16. - PubMed
-
- Buckwalter JA. Aging and degeneration of the human intervertebral disc. Spine. 1995;20(11):1307–14. - PubMed
-
- Pearce RH, Grimmer BJ, Adams ME. Degeneration and the chemical composition of the human lumbar intervertebral disc. J Orthop Res. 1987;5(2):198–205. - PubMed
Publication types
MeSH terms
Grants and funding
LinkOut - more resources
Full Text Sources
Other Literature Sources
Medical
Miscellaneous
