Review
. 2011 May;12(5):363-76.
doi: 10.1038/nrg2958. Epub 2011 Mar 1.

Genome structural variation discovery and genotyping

Affiliations
Review

Genome structural variation discovery and genotyping

Can Alkan et al. Nat Rev Genet. 2011 May.

Abstract

Comparisons of human genomes show that more base pairs are altered as a result of structural variation - including copy number variation - than as a result of point mutations. Here we review advances and challenges in the discovery and genotyping of structural variation. The recent application of massively parallel sequencing methods has complemented microarray-based methods and has led to an exponential increase in the discovery of smaller structural-variation events. Some global discovery biases remain, but the integration of experimental and computational approaches is proving fruitful for accurate characterization of the copy, content and structure of variable regions. We argue that the long-term goal should be routine, cost-effective and high quality de novo assembly of human genomes to comprehensively assess all classes of structural variation.


Figures

Figure 1
Figure 1. Classes of structural variation
Traditionally, structural variation refers to genomic alterations that are larger than 1 kb in length, but advances in discovery techniques have led to the detection of smaller events. Currently, >50 bp is used as an operational demarcation between indels and copy number variants (CNVs). The schematic depicts deletions, novel sequence insertions, mobile-element insertions, tandem and interspersed segmental duplications, inversions and translocations in a test genome (lower line) when compared with the reference genome.
Figure 2
Figure 2. Structural variation sequence signatures
There are four general sequence-based analytical approaches used to detect structural variation. Theoretically, read-pair (RP), split-read and assembly methods can be used to discover variants from all classes of structural variant (SV), but each has different biases depending on the underlying sequence content of the variants and the data properties of the sequence reads. However, read-depth approaches can be used to detect only losses (deletions) and gains (duplications), and cannot discriminate between tandem and interspersed duplications. Briefly, read-pair methods analyse the mapping information of paired-end reads and their discordancy from the expected span size and mapped strand properties. Sensitivity, specificity and breakpoint accuracy are dependent on the read length, insert size and physical coverage,,,,,,,. Breakpoints are indicated by red arrows. Read-depth analysis examines the increase and decrease in sequence coverage to detect duplications and deletions, respectively, and predict absolute copy numbers of genomic intervals,,-. Split-read algorithms are capable of detecting exact breakpoints of all variant classes by analysing the sequence alignment of the reads and the reference genome; however, they usually require longer reads than the other methods and have less power in repeat- and duplication-rich loci,,. Assembly algorithms-, have the most power to detect SVs of all classes at the breakpoint resolution, but assembling short sequences and inserts often result in contig/scaffold fragmentation in regions with high repeat and duplication content. MEI, mobile-element insertion. Repbase is a database of repetitive elements.
Figure 3
Figure 3. Copy number variant discovery biases
a | Three different technologies have been applied to copy number variant (CNV) discovery for DNA obtained from the same five individual genomes (NA18517, NA19240, NA12878, NA19129 and NA12156). The experimental methods are: fosmid paired-end sequencing,, array comparative genomic hybridization (array CGH) and SNP microarray genotyping. In this Venn diagram, only copy-number gains and losses of >5 kb are compared. SNP microarray CNVs in this study are biased towards common copy-number polymorphisms, which explains, in part, the fewer calls and the greater overlap with the other data sets. The fosmid end-sequence pair method also detects inversions, which are not considered in this analysis. b | This Venn diagram shows the numbers of unique and shared structural variants (SVs) found by different sequencing-based discovery approaches that have been used in the 1000 Genomes Project and shows that the approaches are complementary. Read-pair, read-depth and split-read methods (involving 14 distinct algorithms) were applied to the same 185 genomic DNA samples. The proportion of the total number of SVs discovered by one approach that is unique to that approach may be as high as ~80%. Read-pair and split-read methods show the greatest extent of overlap. Read depth and split read are the most discordant approaches, with fewer than 20% of SVs detected by one approach detected by the other (assembly approaches are not compared as they are still in the development stage). The main differences in SV detection between these approaches are primarily found in duplication- and repeat-rich regions. Part a is modified, with permission, from REF. © (2010) Elsevier. Part b is modified, with permission, from REF. © (2011) Macmillan Publishing Ltd. All rights reserved.
Figure 4
Figure 4. Genotyping duplicated paralogues using next-generation sequencing
a | Singly unique nucleotide (SUN) identifiers that distinguish paralogues from each other (red) are shown in the multiple sequence alignment of duplicated genes. These are distinguished from paralogous sequence variants that are not unique to a specific copy (blue). b | Read depth is measured at the SUN positions and used to estimate the copy number of each specific member of the amylase gene family. Across the top, each column represents a different individual from the 1000 Genomes Pilot Project. The colours represent the population identifiers: YRI (Yoruba in Ibadan, Nigeria) is shown in blue; CEU (Utah residents with northern and western European ancestry) is shown in green; and CHB/JPT (Chinese from Beijing, China, and Japanese from Tokyo, Japan) is shown in red. The corresponding copy-number prediction is depicted as a heat map. The pancreatic amylase genes (AMY2A and AMY2B) show little variation compared with the salivary amylase gene family (AMY1 genes). AMYP1 is a pseudogene. AMY1B shows the greatest copy-number variability, ranging from 0 to 9 copies. A schematic of the gene cluster is shown underneath the heat map; 2B represents AMY2B, and so forth. c | Aggregate paralogue-specific copy number (psCN) genotypes of AMY1 paralogues with estimates obtained by quantitative PCR (qPCR) directed at the three functional AMY1 copies compared across 25 JPT individuals. These data show that the qPCR and read-depth data correlate. Data for part b and the y axis of part c are taken from REF. ; data for the x axis of part c are taken from REF. .
Figure 5
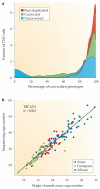
Figure 5. Improved copy number variant genotyping by the integration of computational and experimental approaches
a | Absolute copy-number predictions made using sequence read depth are compared to copy-number genotype calls made using SNP microarrays (Affymetrix 6.0) on DNA from the same 114 individuals. The comparison shows good concordance in unique regions of the human genome (non-duplicated, red) when compared to all CNVs, including duplicated regions (uncorrected, blue). 94% of the discrepancies contain segmental duplications corresponding to 300 gene models. Analysis of the regions suggests population average copy numbers that differ from n = 2 (diploid). Readjusting the population average copy by an integer value using the read-depth estimations within the population ameliorates this bias (corrected, green) (change from 70% to 83% concordance). b | Single-channel array comparative genomic hybridization (array CGH) data (Agilent Technologies) is highly correlated with read-depth-based copy-number predictions for the highly duplicated TBC1D3 gene family. This calibration with absolute copy-number prediction allows for a more accurate prediction of the copy number of duplicated regions for future array CGH experiments. Part b is modified, with permission, from REF. © (2010) American Association for the Advancement of Science.

References

    1. Iafrate A J, et al. Detection of large-scale variation in the human genome. Nature Genet. 2004;36:949–951. The first report of CNVs in the human genome using array CGH.

    1. Redon R, et al. Global variation in copy number in the human genome. Nature. 2006;444:444–454. - PMC - PubMed
    1. Tuzun E, et al. Fine-scale structural variation of the human genome. Nature Genet. 2005;37:727–732. The first study to implement a paired-end sequencing approach to study structural variation.

    1. Kidd JM, et al. Mapping and sequencing of structural variation from eight human genomes. Nature. 2008;453:56–64. - PMC - PubMed
    1. Conrad D F, et al. Origins and functional impact of copy number variation in the human genome. Nature. 2010;464:704–712. This study represents the first application of an ultra-high-density CGH array.

Publication types

MeSH terms