. 2011 Feb 17;6(2):e17206.
doi: 10.1371/journal.pone.0017206.

Secretion of novel SEL1L endogenous variants is promoted by ER stress/UPR via endosomes and shed vesicles in human cancer cells

Affiliations

Secretion of novel SEL1L endogenous variants is promoted by ER stress/UPR via endosomes and shed vesicles in human cancer cells

Monica Cattaneo et al. PLoS One. .

Abstract

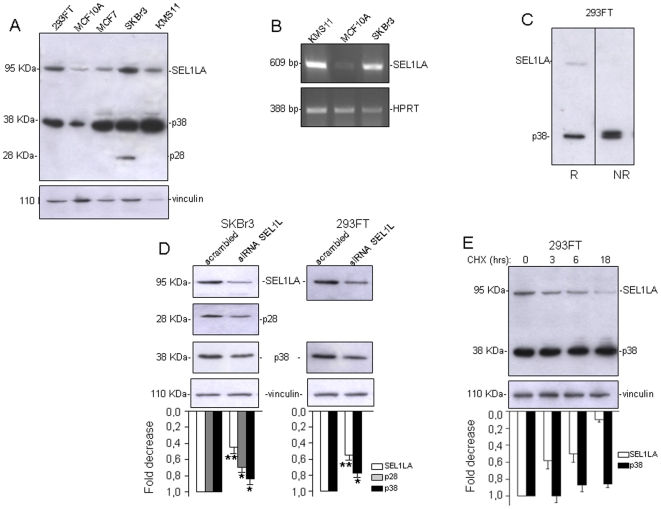
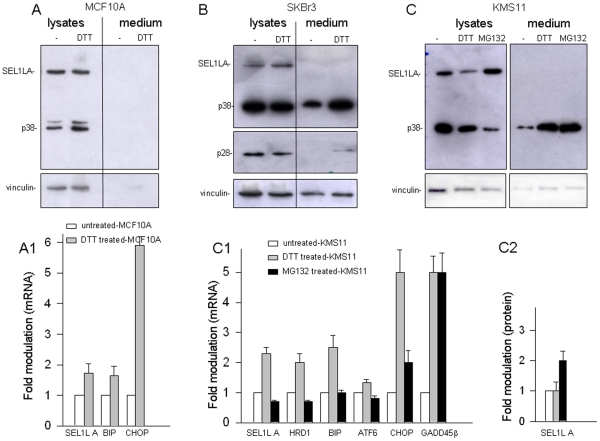
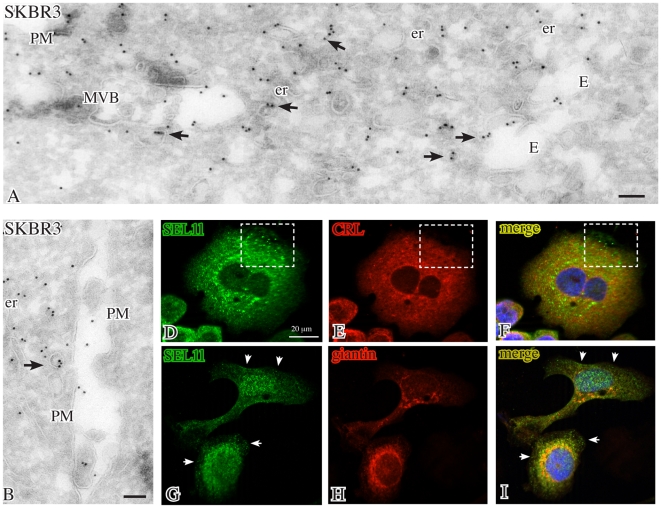
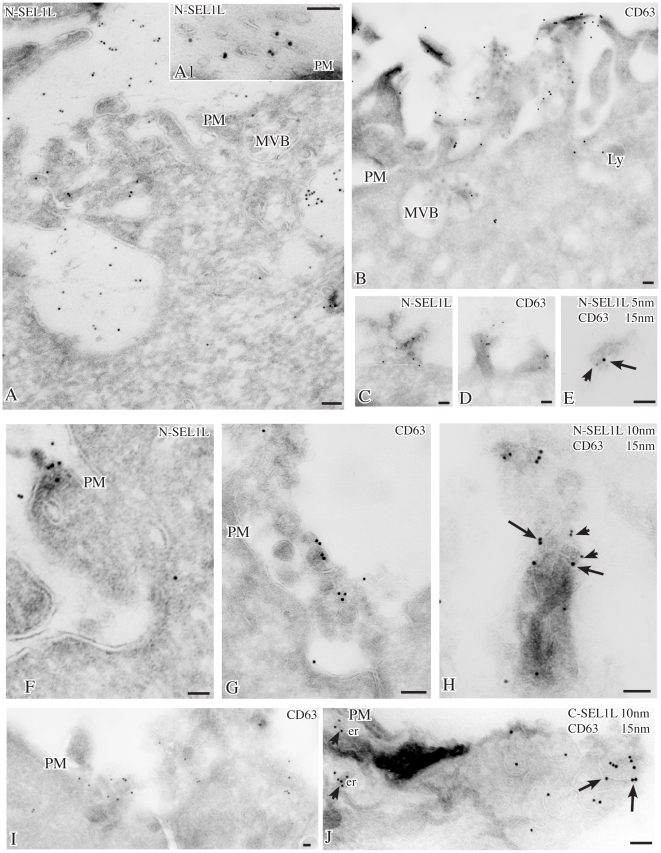
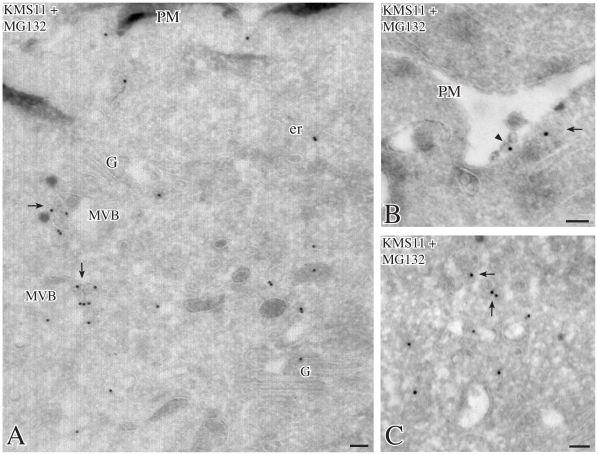
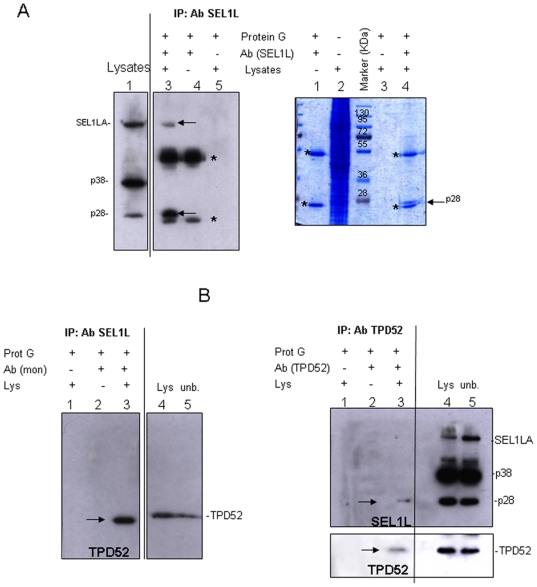
We describe here two novel endogenous variants of the human endoplasmic reticulum (ER) cargo receptor SEL1LA, designated p38 and p28. Biochemical and RNA interference studies in tumorigenic and non-tumorigenic cells indicate that p38 and p28 are N-terminal, ER-anchorless and more stable relative to the canonical transmembrane SEL1LA. P38 is expressed and constitutively secreted, with increase after ER stress, in the KMS11 myeloma line and in the breast cancer lines MCF7 and SKBr3, but not in the non-tumorigenic breast epithelial MCF10A line. P28 is detected only in the poorly differentiated SKBr3 cell line, where it is secreted after ER stress. Consistently with the presence of p38 and p28 in culture media, morphological studies of SKBr3 and KMS11 cells detect N-terminal SEL1L immunolabeling in secretory/degradative compartments and extracellularly-released membrane vesicles. Our findings suggest that the two new SEL1L variants are engaged in endosomal trafficking and secretion via vesicles, which could contribute to relieve ER stress in tumorigenic cells. P38 and p28 could therefore be relevant as diagnostic markers and/or therapeutic targets in cancer.


Conflict of interest statement

Competing Interests: The authors have declared that no competing interests exist.

Figures

Figure 1
Figure 1. p38 and p28 are related SEL1L variants.
A. Western blot analysis: Lysates (50 ug) from different cell lines, including 293FT (embryo kidney), MCF10A (non-tumorigenic breast), MCF7, SKBr3 (breast cancer) and KMS11 (multiple myeloma), were resolved by SDS-PAGE (10%) and probed with monoclonal to SEL1L N-terminus. Vinculin was used as a loading control. In addition to SEL1LA (95 KDa), the N-terminal SEL1L antibody recognized two smaller encoded products, at approximately 38 and 28 KDa (designated p38 and p28). P38 was more abundant than SEL1LA and both were up-modulated in the cancer cell lines relative to MCF10A. P28 was detectable only in SKBr3. Bands above p38, probably corresponding to immature precursors or post-translationally modified products, were occasionally seen in the tested cell lines. The blot is representative of four independent experiments. B. RT-PCR analysis: RNAs from KMS11, MCF10A and SKBr3 cells were analyzed by RT-PCR using primers specific for SEL1LA. Signals shown were obtained with 27 cycles for SEL1LA. HPRT was used as a loading control. SEL1LA was up-modulated in the cancer cell lines relative to the non-tumorigenic MCF10A line. The image is representative of three different assays based on independent treatments. C. Intra/inter-molecular disulfide bonds analysis of p38. 293FT cell lysates were resolved by SDS-PAGE (10%) under reducing (R) and non-reducing (NR) conditions and blotted with monoclonal anti-SEL1L N-terminus. P38 migrated as a doublet under non-reducing conditions (the lanes comparing p38 migration under reducing and non-reducing conditions are from the same gel). D. Down-modulation of SEL1LA, p28 and p38 by SEL1L small interfering RNA (siRNA): Left panel: SKBr3 cells (3×10⁵) were treated with scrambled siRNA or siRNA specific to SEL1L (siRNA SEL1L) for 48 hrs, followed by a second siRNA treatment for further 48 hrs. Silencing efficiency was verified by Western blot. SEL1LA, p28 and p38 protein levels decreased close to 55%, 30% and 16% respectively compared to cells treated with scrambled siRNA. Vinculin was used as a loading control. Right panel: 293FT cells (6×10⁵) were treated with scrambled siRNA or siRNA-SEL1L for 48 hrs. SEL1LA and p38 protein levels decreased close to 45% and 23% respectively compared to cells treated with scrambled siRNA. Vinculin was used as a loading control. The histograms show values normalized relative to housekeeping signals and expressed as fold modulation relative to controls, densitometric analysis was determined using the Scion imaging program. (www.scioncorp.com). The data are the averages of three independent experiments, ±SD; Student's t-test was used to determine statistical significance *p<0.1; **p<0.05. E. Analysis of p38 and SEL1LA stability: 293 FT cells (6×10⁵) were treated for 3, 6 and 18 hours with cycloheximide (CHX, 200 µg/ml). Aliquots of lysates (50 µg) were resolved by SDS-PAGE (10%) and probed with monoclonal anti-SEL1L and anti-vinculin antibodies. Unlike SEL1LA, which progressively decreased during cycloheximide exposure up to about 90%, p38 levels did not change significantly. The histogram shows the densitometric quantifications obtained through Scion imaging program (www.scioncorp.com). Values were normalized relative to housekeeping signals and expressed as fold modulation relative to untreated samples. The data are averages of two independent experiments, ±SD.
Figure 2
Figure 2. Analysis of p38 and p28 secretion in SKBr3, KMS11 and MCF10A cells exposed to chemical and pharmacological treatments.
A. Western blot analysis of untreated and DTT-treated MCF10A cells: MCF10A cells were exposed to DTT (2 mM) for 3 hours and successively maintained for 24 hrs in OPTIMEM. Secreted protein (50 µg) extracted from the culture medium by TCA precipitation, and aliquots of cell lysates (50 µg) were resolved by SDS-PAGE (10%) and blotted with monoclonal anti-SEL1L and anti-vinculin antibodies. P38 was not detectable in the culture medium, both in presence and in absence of DTT. In addition to p38, MCF10A cells showed a higher band, probably corresponding to an immature precursor or post-translationally-modified product. The image is representative of two independent experiments. A1. RT-PCR analysis of untreated and DTT-treated MCF10A cells: RNA was extracted from the samples described in panel A and analyzed by RT-PCR for the UPR response. The histogram shows expression values normalized relative to housekeeping signals and expressed as fold modulation relative to the untreated samples; densitometric analysis was performed by Scion imaging program. UPR activation upon DTT treatment is indicated by up-modulation of BIP and CHOP and XBP-1 splicing, concomitantly SEL1LA is incremented (gray bar). The corresponding images are shown in Figure S2A. The data are the averages of two different assays based on independent treatments, ±SD. B. Western blot analysis of untreated and DTT-treated SKBr3 cells: Secretion of p38 and p28 was evaluated in untreated and DTT-treated SKBr3 cells. Cells exposed to DTT (2 mM) for 3 hrs or not exposed were maintained for 24 hrs in OPTIMEM. Secreted protein (50 µg) extracted from the culture medium by TCA precipitation, and aliquots of cell lysates (50 µg) were resolved by SDS-PAGE (12%) and blotted with anti-SEL1L and anti-vinculin antibodies. ER stress/UPR strongly promoted secretion of p38 and, to a lesser extent, p28 in the culture medium. The image is representative of five independent experiments. C. Western blot analysis of KMS11 cells treated with DTT and MG132: KMS11 cells were exposed to DTT (2 mM) or MG132 (10 µM) for 3 hrs and successively maintained for 24 hrs in OPTIMEM. Secreted protein (30 µg), extracted from the culture medium by TCA precipitation, and aliquots of cell lysates (50 µg) were resolved by SDS-PAGE (10%) and blotted with anti-SEL1L and anti-vinculin antibodies. Both treatments markedly induced p38 secretion in the culture medium. The image is representative of five independent experiments. C1. RT-PCR analysis of KMS11 cells treated with DTT and MG132: RNA was extracted from the same samples described in panel C and analyzed by RT-PCR for the UPR response. The histogram shows expression values normalized relative to housekeeping signals and expressed as fold modulation relative to untreated samples; densitometric analysis was determined by Scion imaging program. UPR activation upon DTT treatment is indicated by the up-modulation of ATF6, BIP, and CHOP and by XBP-1 splicing (see Figure S2C), concomitantly the expression of SEL1LA, HRD1 and GADD45β is incremented (gray bar). The corresponding images are shown in Figure S2C. MG132 treatment did not trigger UPR activation, as indicated by the absence of ATF6 and BIP un-modulation and lack of XBP-1 splicing (see Figure S2C), nevertheless, CHOP and GADD45β were markedly up-modulated and SEL1LA and HRD1 down-modulated (black bars). The data are averages of four different assays based on independent treatments, ±SD. C2. SEL1LA protein expression in KMS11 cells treated with DTT and MG132: The histogram shows SEL1LA protein expression values obtained from the samples described in panel C, normalized relative to housekeeping signals and expressed as fold modulation relative to the untreated sample; densitometric analysis was performed using the Scion imaging program. MG132 determined SEL1LA protein accumulation up to 2 times relative to the control level (black bar). The data are the averages of four independent experiments, ±SD.
Figure 3
Figure 3. Localizations of SEL1L in untreated SKBr3 cells.
Cryoimmunogold electron microscopy of untreated SKBr3 cells labeled with 10 nm gold for N-terminal SEL1L (panels A, B) shows intense staining of vesicles (arrows) dispersed in the peripheral cytoplasm and sometimes associated with multivesicular bodies and endosomes. Immunofluorescence reveals that SEL1L (green) extensively colocalizes (yellow) with the endoplasmic reticulum marker calreticulin and, in a few dots, with the Golgi marker giantin (red), with the exception of discrete cytoplasmic foci (panels D–F, squares) and of the peripheral cytoplasm (panels G–I, arrows). Bars: 0.1 µm; E: endosomes; er: endoplasmic reticulum; MVB: multivesicular body; PM: plasma membrane.
Figure 4
Figure 4. Localizations of SEL1L in DTT-treated SKBr3 cells.
After DTT treatment for 3 hrs, gold particles for N-terminal SEL1L (10 nm) are found by cryoimmunogold electron microscopy along the microvilli (panel A) and on membrane-bound vesicles in the extracellular space (panels A, A1) or emerging from the plasma membrane (panels C, F). Similarly, labeling for the tetraspan protein CD63 is detected in multivesicular bodies and in vesicles at the cell surface (panels B, D, G, I). By double immunolabeling (panels E, H), N-terminal SEL1L (5–10 nm gold, arrowheads) localizes in CD63-positive (15 nm gold, arrows) exosomes, while C-terminal SEL1L (panel J, arrowhead) is confined in the endoplasmic reticulum. Bars: 0.1 µm; E: er: endoplasmic reticulum; Ly: lysosomes; MVB: multivesicular body; PM: plasma membrane.
Figure 5
Figure 5. Localizations of SEL1L in MG132-treated KMS11 cells.
Cryoimmunogold electron microscopy of MG132-treated cells labeled with 15 nm gold for SEL1L N-terminus shows SEL1L localized mainly in internal vesicles of multivesicular bodies (arrows); with additional labeling in the endoplasmic reticulum, Golgi complex and intracellular vesicles (panels A, C, arrows). In panel B a small SEL1L-labeled multivesicular body (arrow) lies in direct apposition to the plasma membrane. Exosomal-like vesicles, that seem to originate from fusion of this multivesicular body with the plasma membrane, bud into the extracellular space (arrowhead), suggesting that SEL1L is secreted via exosomes derived from the multivesicular body. Bars: 0.1 µm; er: endoplasmic reticulum; G: Golgi apparatus; MVB: multivesicular body; PM: plasma membrane.
Figure 6
Figure 6. SEL1L and TPD52 immunoprecipitations assays.
A. SEL1LA and p28 immunoprecipitation analysis: Left panel: SKBr3 cell lysates (1.4 mg) were immunoprecipitated with monoclonal anti-SEL1L antibody (lane 3), resolved by SDS-PAGE (10%) and probed with monoclonal anti-SEL1L antibody. Lysate aliquots (50 µg, lane 1) were loaded to verify protein expression levels and immunoprecipitation efficiency. Arrows indicate the immunoprecipitated bands, asterisks (*) correspond to heavy and light chains. Absence of signal in controls (lanes 4 and 5) confirms the specificity of the immunoprecipitated bands. Right panel: SKBr3 cell lysates (7.0 mg) were immunoprecipitated with monoclonal anti-SEL1L antibody (lane 4), resolved by SDS-PAGE (10%) and stained with Coomassie brilliant blue. Asterisks (*) correspond to heavy and light chains. The arrow indicates the immunoprecipitated band analyzed by mass spectrometry. Absence of signal in controls (lanes 1 and 3) confirms the specificity of the immunoprecipitated band. B. Analysis of the interaction between SEL1L variants and TPD52: Left panel: SKBr3 cell lysates (1.4 mg) were immunoprecipitated with monoclonal anti-SEL1L antibody (lane 3), resolved by SDS-PAGE (10%) and probed with polyclonal anti-TPD52 antibody. Lysate aliquots (40 µg, lane 4) were loaded to verify protein expression levels and immunoprecipitation efficiency. Lane 5 corresponds to unbound aliquots of the samples loaded in lane 4 (40 µg). The arrow indicates the immunoprecipitated band. Absence of signal in controls (lanes 1 and 2) confirms immunoprecipitation specificity. Right panel: SKBr3 lysates (1.4 mg) were immunoprecipitated with polyclonal anti-TPD52 antibody (lane 3), resolved by SDS-PAGE (10%) and probed with monoclonal anti-SEL1L antibody. Lysate aliquots (40 µg, lane 4) were loaded to verify protein expression levels and immunoprecipitation efficiency. Lane 5 corresponds to unbound aliquots of the samples loaded in lane 3 (40 µg). The membrane was successively re-probed with anti-TPD52 antibody. Arrows indicate the immunoprecipitated bands. Absence of signal in controls (lanes 1 and 2) confirms immunoprecipitation specificity.

References

    1. Reed SI. The ubiquitin-proteasome pathway in cell cycle control. Results Probl Cell Differ. 2006;42:147–181. - PubMed
    1. Chen ZJ. Ubiquitin signalling in the NF-kappaB pathway. Nat Cell Biol. 2005;7:758–765. - PMC - PubMed
    1. Bader N, Jung T, Grune T. The proteasome and its role in nuclear protein maintenance. Exp Gerontol. 2007;42:864–70. - PubMed
    1. Lecker SH, Goldberg AL, Mitch WE. Protein degradation by the ubiquitin-proteasome pathway in normal and disease states. J Am Soc Nephrol. 2006;17:1807–19. - PubMed
    1. Rao RV, Ellerby HM, Bredesen DE. Coupling endoplasmic reticulum stress to the cell death program. Cell Death and Differentiation. 2004;11:372–380. - PubMed

Publication types

MeSH terms